EV Post-Bill Report Main Insight Module
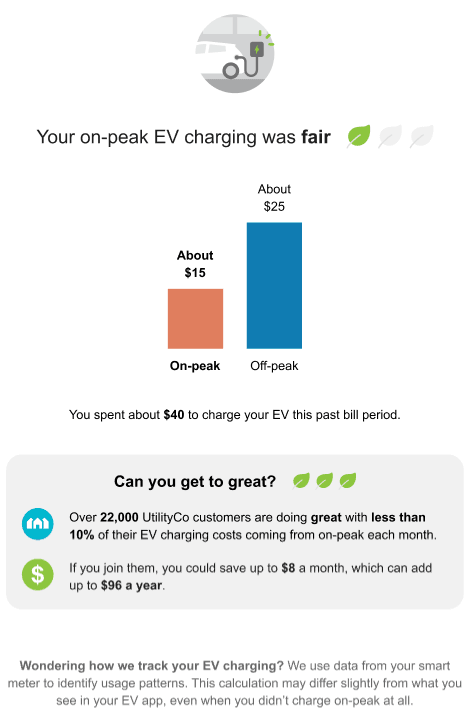
The EV Post Bill Report Main Insight module provides the reader with an overview of their electric vehicle (EV) charging during the most recent billing period. The module rates their charging habits as fair, good, or great, compares their on-peak and off-peak charging, identifies how much they spent charging their vehicle, provides tips to improve their charging habits, and explains how the utility tracks EV charging data.
Requirements
There are no module-specific requirements. For product requirements, see Requirements and Limitations for EV Charging Coach Emails.
User Experience
This module includes the following components. This example is showing the user experience for a customer with two periods in their rate plan that has "fair" charging habits.
Image: The EV charging image appears at the top of the module.
- Fair: One green leaf and two gray leaves.
- Good: Two green leaves and one gray leaf.
- Great: Three green leaves.
Charging Graph: Below the rating statement, a graph depicts how much the reader spent on on-peak and off-peak charging during the billing period.
Spending Statement: Below the chart, a statement provides the total cost of charging the EV during the billing period. For example, "You spent above $40 to charge your EV this past bill period."
Incentive Statement: Below the spending statement, the module includes a section that asks the reader if they can improve their charging habits so they receive a great rating. For example, the header states "Can you get to great?" and includes three green leaves. The module then provides information about the average charging habits of other customers at the utility. This statement begins with a graphic depicting several houses, and reads "Over 22,000 UtilityCo customers are doing great, with less than 10% of their EV charging costs coming from on-peak each month." The last section of the statement begins with a dollar sign graphic, and tells the reader how much they can save, based on their charging this month, if they also receive a great rating. For example, "If you join them, you could save up to $8 a month, which can add up to $96 a year."
Explainer Statement: Below the incentive statement, the explainer statement tells the reader how the utility determines their EV charging information. For example, "Wondering how we track your EV charging? We use data from your smart meter to identify usage patterns. This calculation may differ slightly from what you see in your EV app, even when you didn't charge on-peak at all."

User Experience Variations
This topic discusses how the module can vary.
Chart Display Variations
The chart in the module varies as follows, depending on whether the customer has 2 or 3 periods in their rate plan:
- When the customer's rate plan includes two periods, the chart displays two bars.
- When the customer's rate plan includes three different periods, the chart displays three bars.
Rating Statement and Incentive Statement Variations
This table describes how the statements in the module can vary:
| State | Two Periods | Three Periods |
|---|---|---|
| Good/Fair |
When the customer's on-peak cost is greater than the low threshold (default 10%): Rating Statement: "Your on-peak EV charging was <good/fair>" Incentive Statement: "Over 22,000 UtilCo customers are doing great, with less than 10% of their EV charging costs coming from on-peak this month." |
When the customer's on-peak cost is greater than the low threshold (default 10%): Rating Statement: "Your on-peak EV charging was <good/fair>." Incentive Statement: "Over 22,000 UtilCo customers are doing great, with less than 10% of their EV charging costs coming from on-peak this month." |
| Great |
When the customer's on-peak cost is less than the low threshold (default 10%): Rating Statement: "Excellent! Your on-peak EV charging was great" and is followed by three leaves. Incentive Statement: Does not appear in the module. |
When the customer's on‑peak cost is below the low threshold (10% by default) while the part‑peak cost share is above the low threshold: Rating Statement: "Excellent! Your on-peak EV charging was great" and is followed by three leaves. Incentive Statement: "Can you shift more of your charging to super off-peak? Over 6,000 UtilCo customers charge their EV almost entirely during super off-peak each month. If you join them, you could save up to $7 a month, which can add up to $84 a year." |
| Super Great | Not applicable. Only customers with three periods can have this state. |
When the customer's charging during the highest-cost and middle-cost periods are both less than the low threshold (default 10%): Rating Statement: "Excellent! Your on-peak EV charging was great" and is followed by three leaves. Incentive Statement: Does not appear in the module. |
Icon Variations
- Leaves
- Smiley faces
- Medals
If the utility chooses to use the icons, they are present in both the Rating Statement and the Incentive Statement.
Usage Variation
- Charging Graph: The numbers on the graph depict usage in percentages instead of costs.
- Spending Statement: The statement that typically appears below the chart is not included in the module.