EV Weekly Main Insight Module
The EV Weekly Main Insight module is used to give the reader an overview of their EV charging for the week, provides a comparison to how they charged during on-peak hours the previous week, gives them a tip about how they can improve their charging habits, and explains how the utility identifies their EV charging habits.
Requirements
- AMI (hourly or more granular) data and use of the hourly disaggregation service are required.
- EV charging must be detected by the hourly disaggregation service.
- Only L2 chargers are supported.
- Estimated reads are not supported.
User Experience
This module includes:
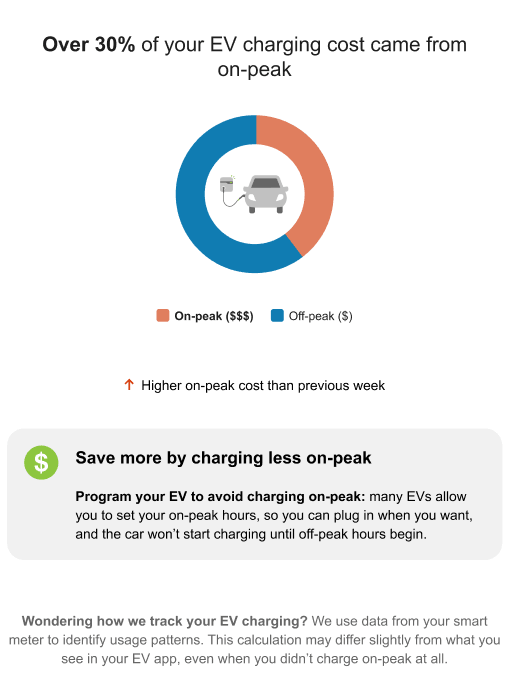
Header: The header statement of the module identifies whether the reader's weekly EV charging costs were above or below the designated high threshold. For example, if the threshold is set at 30%, and EV charging accounted for approximately 35%, the statement would read "Over 30% of your EV charging costs came from on-peak".
Charging Chart: The Image depicts an EV that is plugged in, and is surrounded by a chart that depicts the portions of charging that were done during on-peak and off-peak hours.
Legend: Below the charging image, a legend identifies the colors that are depicted in the charging image chart.
- A green arrow pointing up with a statement that reads, "Higher on-peak cost than previous week"
- A green arrow pointing down with a statement that reads, "Lower on-peak cost than previous week"
- A gray arrow pointing from side to side with a statement that reads, "Same on-peak cost as previous week"
- Program your EV to avoid charging on-peak: many EVs allow you to set your on-peak hours, so you can plug in when you want, and the car won't start charging until off-peak hours begin.
- Schedule your start time: Add convenience to your routine and schedule your start time during off-peak hours so you can plug in whenever you want.
- Do you have a smart charger? If so, you can schedule charging from your charger instead of your EV or EV app.
Explainer Statement: Below the savings statement, the explainer statement tells the reader how the utility determines their EV charging information. For example, "Wondering how we track your EV charging? We use data from your smart meter to identify usage patterns. This calculation may differ slightly from what you see in your EV app, even when you didn't charge on-peak at all."
User Experience Variations
This topic discusses how the EV Main Insight module can vary.
High On-Peak Charging, Two Periods
- Header: The header reads, "Over 30% of your EV charging costs came from on-peak". The percentage shown in the message is the high threshold value that can be configured by the utility.
Medium On-Peak Charging, Two Periods
- Header: The header reads, "Over 10% of your EV charging costs came from on-peak". The percentage shown in the message is the low threshold value that can be configured by the utility.
Low On-Peak Charging, Two Periods
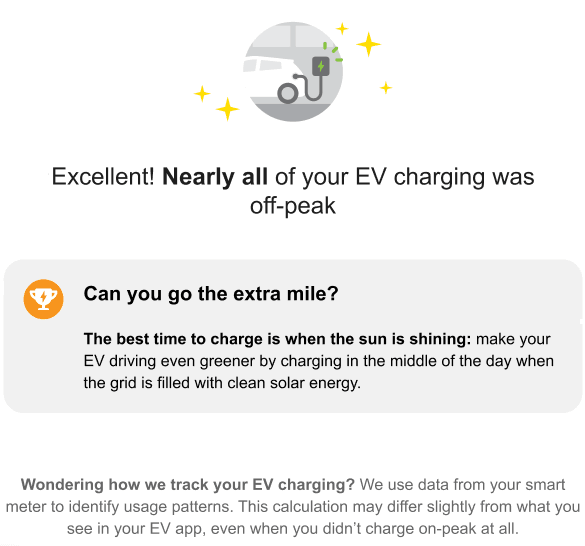
- Image: A new image with an EV charging and several stars appears at the top of the module in place of the standard header.
- Chart, Legend, and Standard Comparative Statement: These items are omitted from the module.
- Header: The header appears below the image, and reads "Excellent! Nearly all of your EV charging was off-peak".
- Low Charging Comparative Statement: Depending on how many weeks the user
has been considered a "low" on-peak charger, they will see one of the
following:
- Week 1 of being a "low" on-peak charger: No statement is displayed.
- Weeks 2-8: The statement begins with a green image of a medal and reads, "<X> weeks in a row of almost no on-peak charging!"
- More than 8 weeks: For all additional consecutive weeks of low charging, the statement begins with a green image of a medal and reads, "More than 8 weeks in a row of almost no on-peak charging!"
- Savings Statement: This item is omitted from the module and is replaced by the Extra Mile Statement.
- Extra Mile Statement: If the user does not charge within the first hour after peak hours end, this statement is not included in the email. If they do charge during that hour, one of three Extra Mile Statements is displayed in place of the Savings Statement. All three begin with the header "Can you go the extra mile?", have a trophy graphic, and are followed by one of these statements, which are selected randomly:
- One way is to delay your scheduled start time: help avoid straining the grid at the beginning of off-peak hours, when many people start charging their vehicle, by setting your schedule to start a couple hours into the off-peak period.
- The best time to charge is when the sun is shining: make your EV driving even greener by charging in the middle of the day when the grid is filled with clean solar energy.
- One way is to set a “departure” time: some vehicles let you set the time you need the car charged and ready to go, and your charging will finish in time for departure. This helps avoid demand spikes on the grid by staggering when EVs start charging.
High or Medium On-Peak Chargers, Three Periods
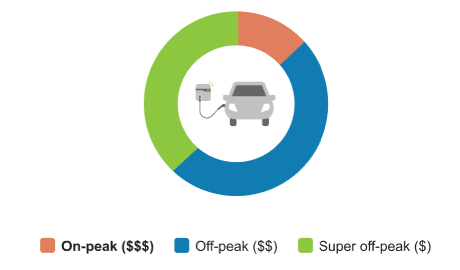
When the user's rate plan has three periods (ie, on-peak, off-peak, and super off-peak), and they charge their EV at high or medium levels, the variations described in the High and Medium variations above occur. Additionally, the chart and legend both include three periods instead of two. This image shows an example of the chart and legend for rate plans with three peak periods:
Low On-Peak with Above Threshold Mid-Peak Charging, Three Periods (Low Charger)
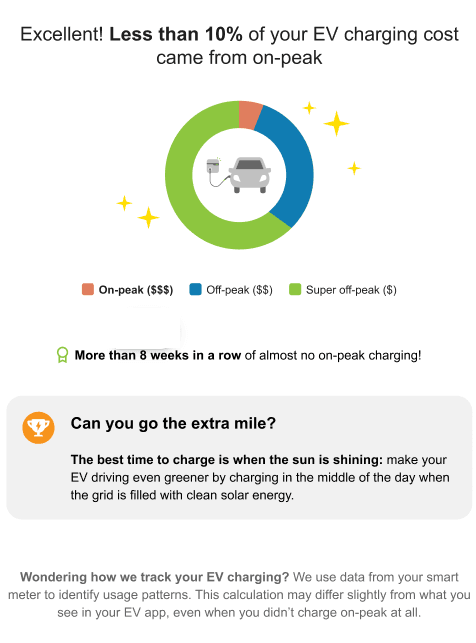
When the user's rate plan has three periods (for example, highest-cost period, mid-cost period, and lowest-cost period), and they charge their EV less than the low threshold percentage (10% by default) during the highest-cost period, but above the low threshold on the mid-cost periods, the user is considered a low on-peak charger, but there is still room for their charging habits to improve. For example, if a user charged their vehicles as follows, the module would fall into this scenario:
- 5% of charging during the highest-cost peak period (below the 10% threshold)
- 15% of charging during the mid-cost peak period (above the 10% threshold)
- 80% of charging during the lowest-cost peak period
In this scenario, the module varies as follows:
- Header: The header appears at the top of the module, and reads "Excellent! Less than 10% of your EV charging cost came from on-peak".
- Graphic: Several star graphics appear around the chart.
- Low Charging Comparative Statement: Depending on how many weeks the user
has been considered a "low" on-peak charger, they will see one of the
following:
- Week 1 of being a "low" on-peak charger: No statement is displayed.
- Weeks 2-8: The statement begins with a green image of a medal and reads, "<X> weeks in a row of almost no on-peak charging!"
- More than 8 weeks: For all additional consecutive weeks of low charging, the statement begins with a green image of a medal and reads, "More than 8 weeks in a row of almost no on-peak charging!"
- Savings Statement: This item is omitted from the module and is replaced by the Extra Mile Statement.
- Extra Mile Statement: One of three Extra Mile Statements is displayed in
place of the Savings Statement. All three begin with the header "Can you go the
extra mile?", have a trophy graphic, and are followed by one of these statements,
which are selected randomly:
- One way is to delay your scheduled start time: help avoid straining the grid at the beginning of off-peak hours, when many people start charging their vehicle, by setting your schedule to start a couple hours into the off-peak period.
- The best time to charge is when the sun is shining: make your EV driving even greener by charging in the middle of the day when the grid is filled with clean solar energy.
- One way is to set a “departure” time: some vehicles let you set the time you need the car charged and ready to go, and your charging will finish in time for departure. This helps avoid demand spikes on the grid by staggering when EVs start charging.
Low On-Peak and Mid-Peak Charging, Three Periods (Super Low Charger)
When the user's rate plan has three periods (ie, highest-cost period, mid-cost period, and lowest-cost period), and they charge their EV less than the low threshold (10% by default) during both the lowest-priced and the mid-priced period, they are considered a super low charger. For example, if a user charged their vehicles as follows, the module would fall into this scenario:
- 5% of charging during the highest-cost peak period (below the 10% threshold)
- 5% of charging during the mid-cost peak period (below the 10% threshold)
- 90% of charging during the lowest-cost peak period
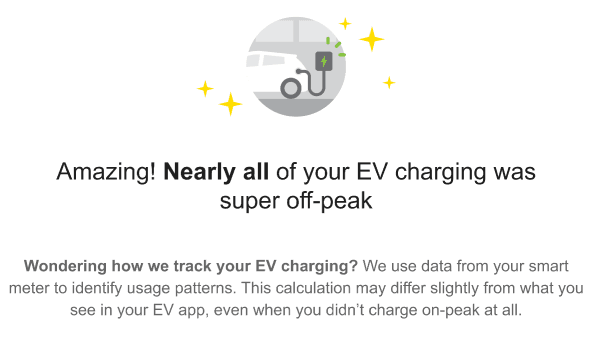
- Image: A new image with an EV charging and several stars appears at the top of the module in place of the standard header.
- Chart, Legend, and Standard Comparative Statement: These items are omitted from the module.
- Header: The header appears below the image, and reads "Excellent! Nearly all of your EV charging was super off-peak".
- Additional Statements: The Savings Statement and the Extra Mile Statement are omitted from the module.
Usage Variation
- Header: The header changes as follows, based on the percentage of EV
charging that was done on-peak:
- High usage: Over x% of your EV charging was on-peak
Note that the default percentage for the usage variation is 20%.
- Low usage: Less than x% of your EV charging was on-peak
Note that the default percentage for the usage variation is 5%.
- Super low usage: Excellent! Nearly all of your EV charging was off-peak
- High usage: Over x% of your EV charging was on-peak
- Comparative Statement: Below the legend, a statement tells the reader how
their charging this week compares to the previous week. The statement begins with
an icon, and can be one of the following:
- A green arrow pointing up with a statement that reads, "Higher on-peak charging than previous week"
- A green arrow pointing down with a statement that reads, "Lower on-peak charging than previous week"
- A gray arrow pointing from side to side with a statement that reads, "Same on-peak charging as previous week"