Viewing Power Flow Results in Real Time
The Viewer's Device Details Power Flow Results tab displays power flow calculation information for energized devices. See “Displaying Asset Details” for information on accessing and using Device Details.
Note: For information regarding what is displayed for de-energized devices, see “Understanding Device Details for De‑Energized Devices”).
As an object is selected in the Viewer, the Power Flow Results tab updates with the calculated feeder voltages and equipment flows. The lower right corner of the Power Flow Results tab will display the time when the last solution was solved.
To view the Power Flow results for a device in real-time, follow these steps:
1. Start the Viewer. If the Viewer is in Study Mode, click the Real-Time () button to set the mode to Real-Time.
2. Click the Viewer's Device Details button () to enable Device Details.
3. Select a device.
4. Select the Power Flow Results tab to display the latest power flow results for the device.
.
Note: To view more information about the power flow conditions, click the Power Flow Solutions Details button (), which will open the Feeder Load Management Feeder Errors, Warnings, and Details dialog box.
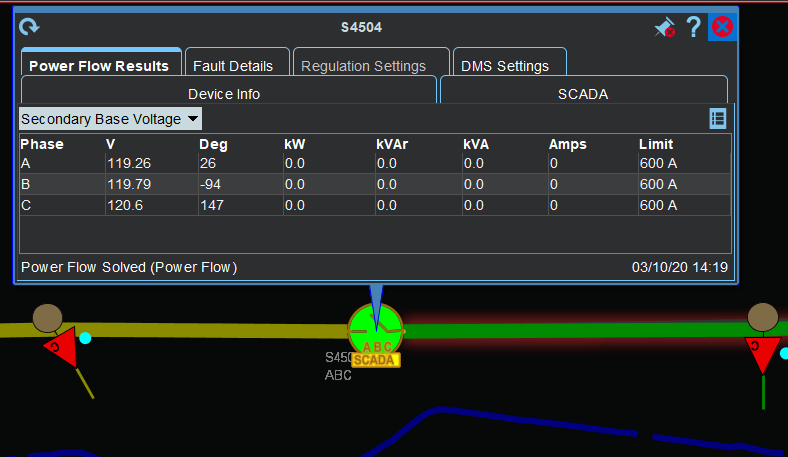
Understanding the Device Details Power Flow Results Data Table
The Device Details Power Flow Results tab displays power flow solutions in a tabular format. The date and time the last power flow solution was conducted for the selected device appears in the bottom right corner of the balloon dialog box.
• The Voltage Display Type drop-down list allows you to select the power flow calculation is displayed. You can change this to any of the following:
• Secondary Base Voltage
• Nominal Base Voltage
• Voltage Percent
• Line to Line Voltage
Note: When using Secondary Base Voltage or Voltage Percent while viewing load voltages, the true secondary side voltage will be displayed factoring in the secondary impedance drop for the device.
• Table Columns
• The Phase column displays the device phase.
• The Deg column displays the voltage phase shift (angle) in degrees.
• The kV column contains calculated voltage in the units selected in the Voltage Display Type. There are multiple options available for Voltage Display Type. If you have selected a multi-phase device, options for Line Voltage, Phase Voltage, Voltage Percent, and Secondary Voltage will be available. On multi-phase devices, the Secondary Voltage and Voltage Percent will show voltage magnitude and phase angle in line to line representation. When values are represented in line to line representation both voltage magnitude and angle values will have the phases involved appended to it. If you have selected a single phase device, the Voltage Display Type for Line Voltage will be removed since a second phase does not exist to do a proper line to line voltage calculation. If you have selected a two phase Delta load, a single row showing both phases involved will be displayed.
Note: If a feeder is configured for kVA solutions, the voltage on the feeder will be constant and not reflect the true drop/rise occurring in the field.
• The kW column contains the calculated voltage in the units selected above.
• The kVAr column contains the phase reactive power flow.
• The Amps column contains the phase current.
• The Limit column contains the phase limit in either Amps, kVAr, or kVA depending on the device type:
• Lines, Switches (Amps)
• Capacitors (kVAr)
• Transformers, Distributed Generation Devices, Loads (kVA)
In Study Mode, the Power Flow Results tab also displays a Refresh button. Clicking this button displays the Study Session Parameters window so you can change the Power Flow Options.