Understanding Viewer Context Menu Options
When you select certain objects in the Viewer and right-click, a context menu will display a list of options available for the object.
Crew Context Menu Options
The following options are displayed when you right-click a crew symbol in the Viewer window; these options are only available for crews with AVL (Automatic Vehicle Location) systems.
Menu Option | Description |
|---|---|
Assign | Assigns the crew selected in the Viewer to the event currently selected in Work Agenda. See “Assigning a Crew to an Event” for more information. |
En Route | Puts the crew selected in the Viewer en route to the event currently selected in Work Agenda. This is enabled only if the selected crew is an on-shift, available, non-mobile crew that is not currently en route or onsite. See “Placing a Crew En Route” for more information. |
Release Crew | Releases the crew selected in the Viewer from the en route/onsite event selected in the Work Agenda. See “Releasing Crews from an Event” for more information. |
Update Availability... | Opens the Update Crew Availability dialog box for the selected crew. See “Changing Crew Availability” for more information. |
Crew Info... | Opens the Crew Info dialog box for the selected crew. See “Using Crew Info” for more information. |
Event Options
The following options are displayed when you select an event symbol and right-click to open the context menu:
Menu Option | Description |
|---|---|
Event Details... | Opens the Event Details window for the event. See “Understanding Event Details”. |
Trouble Info... | Opens the Event Details Trouble Info tab for the event. See “Using the Trouble Info Tab”. |
Event Log... | Opens the Event Details Event Log tab for the event. See “Using the Event Log Tab”. |
Damage Assessments... | Opens the Event Details Damage Assessments tab. See “Using the Damage Assessments Tab”. |
Show Fault Locations | Shows the fault locations for the selected event. |
Hide Fault Locations | Hides all potential fault locations for the selected event. |
Crew Info... | Opens the Crew Info window for the crew assigned to the selected event. See “Using Crew Info”. |
Show En Route Location... | Shows the AVL location of the crew that is currently en route to the selected event. This option is only enabled when one crew is assigned to the event. |
Release Crews... | Opens the Release Crews dialog box. Enabled when one or more crew is assigned to the event. See “Releasing a Crew from the Crew Symbol in the Viewer”. |
Make Predicted Stable | Makes currently selected predicted outage stable. Visible only when currently selected predicted outage can be made stable. See the “Working with Stable Predictions” for more details. |
Remove Predicted Stable | Removes stable flag from the currently selected predicted stable outage. Visible only when a predicted stable outage is selected. See the “Working with Stable Predictions” for more details. |
Condition Options
Condition sizing and locations can be adjusted by an administrator; non-administrators can move conditions temporarily during their session. For conditions, moving a condition affects any conditions at a device position, including future conditions for that device. Measures and conditions may be moved.
Menu Option | Description |
|---|---|
Move | Moves a condition to a new location. If there are multiple conditions at a location, only the condition closest to the device can be moved. |
Show Leader Line | Shows the leader line for the device. |
Hide Leader Line | Hides the leader line. |
Reset Location | Resets the condition position to the default location. |
Rotate Clockwise | Rotates the symbol clockwise (only available for measurements). |
Rotate Counterclockwise | Rotates the symbol counterclockwise (only available for measurements). |
Resize Bigger | Increases the symbol size (only available for measurements). |
Resize Smaller | Reduces the symbol size (only available for measurements). |
Device Options
Depending on the device type, the following options may be displayed when you select a device and right-click to open the context menu:
Menu Option | Description |
|---|---|
Control Tool... | Opens the Control Tool for the selected device. See “Using the Control Tool”. |
Device Details... | Displays the Device Details balloon above the selected device. See “Displaying Device Details”. |
Attributes... | Opens the Attributes window, which displays information about the selected device. See “Viewing Device Attribute Information from the Viewer”. |
Open... | Initiates the Control Tool's Open command. See “Control Tool Actions”. |
Close... | Initiates the Control Tool's Open command, if applicable. See “Control Tool Actions”. |
Customer List... | Displays the Event Details Trouble Info tab's Customers List view. See “Using the Trouble Info Customers View” for more information. |
Damage Assessments... | Opens the Event Details Damage Assessments tab, which displays a list of damage assessments associated with the device and allows you to add new damage assessments. See “Using the Damage Assessments Tab”. |
Quarantine | |
Start Patrolling | |
Remove Assessment | Remove the assessment condition. See |
Focus on Feeder Breaker | Focuses the Viewer window on a breaker currently feeding the selected device. If the device is deenergized, the nominal breaker will display. |
Generate Tag Steps | Allows you to generate a set of steps in the active switch sheet to tag devices upstream from the selected device. These will appear in a new Place Tags steps block. |
Toggle Call Display | Toggles call display on or off. When enabled, a symbol is displayed in the Viewer window for any devices that have calls associated with an event. Events with calls and clues will show the call symbol and clue symbol. 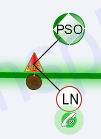 |
Trace... | Opens the Trace tool, which allows you to display the path from a selected device to other devices based on specific criteria. See “Executing Traces”. |
Displaying Device Details
Device Details provides information about devices selected in the Viewer. Device Details is enabled by clicking the Device Details button ( ) in the Viewer's toolbar or by right-clicking a device and selecting Device Details... from the context menu.
) in the Viewer's toolbar or by right-clicking a device and selecting Device Details... from the context menu.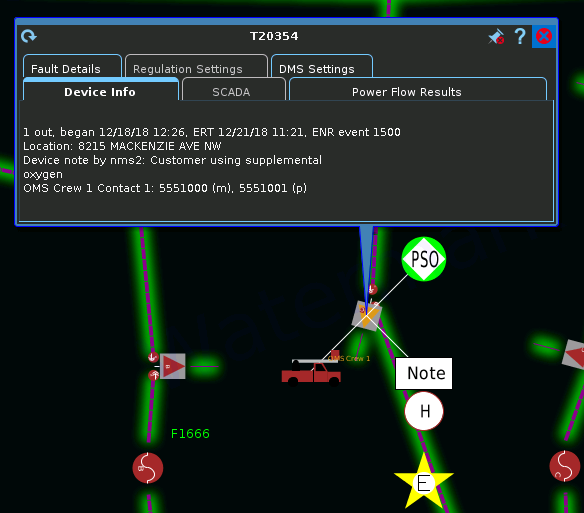
Note: The Viewer's Device Details button is highlighted when enabled.
When Device Details is enabled, selecting a device will automatically launch a balloon-style callout window attached to the device in the Viewer. Selecting a different device will close the first window and open a window for the newly selected device. To keep a window open, you may pin it by clicking the pin button ( ). You may unpin the window by clicking the unpin button (
 ) or close it by clicking the close button (). Device Details windows may be dragged to a different location in the Viewer or resized.
). You may unpin the window by clicking the unpin button () or close it by clicking the close button (). Device Details windows may be dragged to a different location in the Viewer or resized.The Device Details tabbed data views provide relevant information based on the object selected. Data is refreshed whenever you select a different tab, but you may manually refresh the data by clicking the refresh button (). Click the Help button () to display help for the active tab.
The Device Details tabs provide the following information:
Device Info: The information contained in the Device Info tab varies depending on the type of device and its current condition, but may include the following types of information:
• Event information, such as number of customers affected, when the event began, estimated restoration time, event type, event number
• Event Note
• Location
• Device Notes
• Crew information
• SCADA: The SCADA tab displays SCADA device data. It is only enabled for SCADA devices in systems that have implemented SCADA Extensions; see “Resize Smaller: Decreases the size of the measurements. (Administration users only.)Displaying SCADA Measurements with Asset Details” for details.
• Power Flow Results: The Power Flow Results tab displays Power Flow calculation results. It is only enabled in systems that have implemented Power Flow Extensions; see “Understanding the Device Details Power Flow Results Data Table” for details.
• Connected kVA Results: The Connected kVA Results tab displays connected kVA for de-energized devices. The kVA is calculated based on downstream devices in nominal session. The tab is visible only when the selected device is de-energized.
• Fault Details: The Fault Details tab shows fault currents at the selected point in the model. Depending on the conductor selected, data will be displayed for the following fault types:
• Single Phase Fault
• Line to Line Fault
• Three Phase Fault
• Regulation Settings: The Regulation Settings tab displays power engineering information for regulation devices, such as shunt capacitors, reactors, regulators/substation transformers, sources, and distribution generators. The information displayed in the Regulation Settings tab varies by regulation device type.
• Shunt Devices
• On Threshold
• Off Threshold
• Position
Note: The Position will state either "on" or "off" depending on the state of the capacitor. When "off," the device will show as being open in the NMS model.
• Automatic Control
• Regulation Type
• Measurement Type
• Operations Count
• Operations Count Threshold
• Generators
• Voltage
• Angle
• Distribution Generators
• kW
• kVAr
• Voltage Setpoint
• Voltage Regulation
• Status
• Charge Mode
• TTL Expiration
• Wind Speed
Note: The wind speed of the Distributed Energy Resource’s (DER) zone. For a wind DER, it will show the speed of its zone; for other DERs, it will show as N/A.
• Regulator/Transformer
• Voltage Setpoint
Note: If the device is configured for un‑ganged regulation each independent phase specific voltage setpoint will be displayed in this column. For devices that are configured for ganged regulation a single setpoint will be displayed.
• Tap Step
Note: If the device is configured for un‑ganged regulation each independent phase specific tap position will be displayed in this column. For devices that are configured for ganged regulation a single tap position will be displayed.
• Min Tap Step
• Max Tap Step
• LD Comp Z
Note: Represents the line drop compensation settings that are configured for the regulator or transformer.
• Tap Side
• Automatic Control
• Violations: The Violations tab shows a list of violations and warnings at the selected point in the model.
• DMS Settings: The DMS Settings tab displays DMS settings for the feeder that the device is on; the settings are configured using the Configuration Assistant Feeder Management tab (see Using the Feeder Management Tab on page 24-32 for information). The DMS Settings tab includes the following information:
• Substation
• Feeder
• PF Mode (hidden by default)
• FLISR
• FLM
• FLA
• Optimization
• Optimization Objective
• Protection Schemes
• Protection Schemes Mode
• Feeder Type (hidden by default)
Note: See “Understanding Column Display Options” for information on unhiding and hiding table columns.
Viewing Device Attribute Information from the Viewer
You can access attribute information related to a device using the Viewer. Device attributes include physical and reference information about a device, such as location and rating.
To view device attributes from the Viewer, complete these steps:
1. Right-click a device in the Viewer.
2. From the context menu, click Attributes…. The Attributes window opens as a dockable pane in the Viewer.