Forecast Accuracy Tab
The Forecast Accuracy tab shows the historical accuracy of previous forecasts and is useful for determining the likely accuracy of current forecasts. By default, the Forecast Accuracy tab shows a week of forecast data.
Toolbar Buttons
The Forecast Accuracy toolbar provides the following options:
• The Begin Time and End Time date/time selectors allow you to change the amount of data displayed.
Note: The amount of historical data kept online is determined by the system administrator.
• Click the Trend Graph button () to open the trend graph for the selected row.
• Click the Focus button () to focus the Viewer on a selected feeder.
• Click the Print button () to print the Forecast Accuracy table.
• Click the Export button () to export the data in the Forecast Accuracy table.
• Click the Auto Filter button to show only rows that match the selected cell. Once an auto filter is applied, this button is replaced by the Auto Filter Off button.
• Click the Auto Filter Off button to remove a previously selected auto filter.
The toolbar also displays the names of applied filter.
Forecast Accuracy Table
The Forecast Accuracy table displays the following columns by default:
• The Substation: The substation name.
• Feeder: The feeder name.
• Date/Time: The date and time of the forecast.
• Num Forecasts: the number of forecasts.
• kW Forecast: The average forecast for 3-phase total kW.
• kW Actual: The actual kW value.
• kW Forecast Error (%): The error between the forecast kW to the actual kW.
• kVAr Forecast: The average forecast for 3-phase total kVAr.
• kVAr Actual: The actual kVAr value.
• kVAr Forecast Error (%): The error between the forecast kVAr and the actual kVAr.
The following columns are hidden by default (see “Understanding Column Display Options” for details on hiding and unhiding columns):
• Load Forecast: The average forecast for True Load.
• Load Actual: The actual True Load value.
• Load Forecast Error (%): The error between the forecast True Load to the actual True Load.
• Gen Forecast: The average forecast for Generation.
• Gen Actual: The actual Generation value.
• Gen Forecast Error (%): The error between the forecast Generation to the actual Generation.
• kW Max: Maximum forecast for 3-phase total kW.
• kW Min: Minimum forecast for 3-phase total kW.
• kVAr Max: Maximum forecast for 3-phase total kVAr.
• kVAr Min: Minimum forecast for 3-phase total kVAr.
• Load Max: Maximum forecast for 3-phase total True Load.
• Load Min: Minimum forecast for 3-phase total True Load.
• Gen Max: Maximum forecast for 3-phase total Generation.
• Gen Min: Minimum forecast for 3-phase total Generation.
• kW StdDev: Standard deviation of forecasts for 3-phase total kW.
• kVAr StdDev: Standard deviation of forecasts for 3-phase total kVAr.
Forecast Accuracy Trend Graph
The Forecast Accuracy trend graph displays a graph of the data for the selected row. The trend graph displays the following data by default:
• Average forecast values for kW and kVAr.
• Actual values seen for kW and kVAr.
• Forecast error for kW and kVAr.
You can use the mouse wheel to zoom in and out. You can also drag the graph to see details over the time line.
You may also widen or shrink the viewport to show more or less detail. Hovering over the viewport left or right side will change the cursor to allow you to resize the box.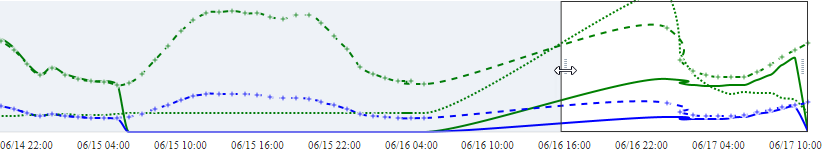
Hovering the mouse over the trend will show the value at the point in the graph.