Working with the Map
The Map provides an operational, interactive, real-time view of the distribution network. It provides context, improves situational awareness, and allows you to update the network directly.
As a Flex Operations user, you can interact with the Map to understand the current network state and assist in the outage management process. You can:
• Visualize and manage outages.
• View information about network assets like switches, conductors, and customers.
• Record device operations.
• Annotate the Map with notes and device tags.
• Add Damage Reports.
• Record Patrolling updates.
• Print the map..
See “Selecting and Interacting with Map Objects using the Selection Panel” for more information.
Displaying the Map
By default, the Map is displayed as a new tab in your browser. You can tear off the tab and display it as a standalone window if required. This enables you to display the map and the Events and Crews side by side, if required.
To display the Map:
• From the Workspace Tool Selector, select Map.
• To view the location of an outage event on the Map, select an event then click the Focus button ( ).
).
). Note: The Map displays in a new browser tab, but, if desired, you can drag the browser tab outside of the browser window to display the Map side‑by‑side with your Events and Crews tool.
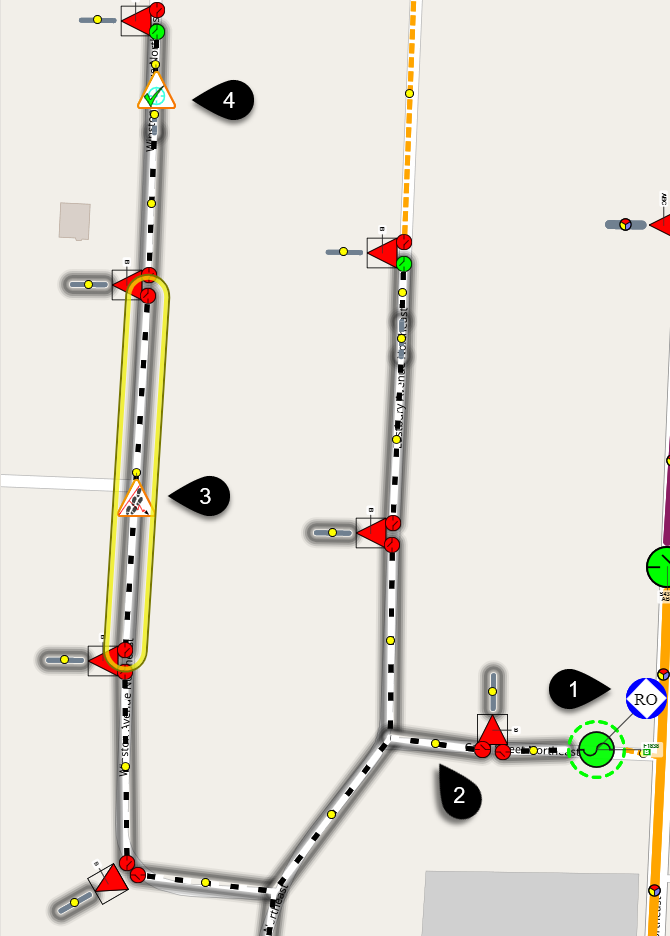
The Map provides visual cues and symbols to represent devices, events, and conditions.
For example, the following screen capture depicts [1] an abnormally open switch with a real outage (RO symbol), [2] the resulting de-energized section of the network, [3] a highlighted segment with a Patrolling symbol, and [4] a device patrolled symbol.
You can view conductor and condition coloring settings by selecting the Map Color Legend... from the Map’s View menu.

Understanding Map Settings
To display the Settings panel, click the gear button  . Options here enable you to change visualization and behavior of the Map. Note that the Map updates as you adjust them. Some options may have assigned shortcuts:
. Options here enable you to change visualization and behavior of the Map. Note that the Map updates as you adjust them. Some options may have assigned shortcuts:• Landbase Source: Enables you to select different landbases.
• Landbase Opacity: Select the visual intensity of the landbase.
• Map Theme: The Map theme can be changed to support low-lit or well-lit working environments. The following options are available:
• Automatic (Follow Theme): Inherits the Light or Dark theme selected in the main Flex Operations Settings panel.
• Dark: Displays the dark Map theme regardless of the currently applied Flex Operations theme.
• Light: Displays the light Map theme regardless of the currently applied Flex Operations theme
• Symbol Scale: Select the preferred symbol size/scale (applies to devices and symbols)
• Big Symbols: When selected displays preconfigured symbols larger when zoomed out.
• Big Symbol Scale: Select the scale of big symbols, when they are displayed.
• Line Scale: Select the thickness of conductors.
• Text Scale: Select the size of text displayed in labels
• Condition Distance Scale: Select the distance at which conditions and outage symbols display from their associated device.
• Conductor Highlight Blur: Display conductor highlighting with sharp edges, or with blurred edges.
• Conductor Highlight Opacity: Select the intensity/opacity of the highlighting.
• Conductor Highlighting Scale: Select the thickness of conductor highlighting.
• Trace Outline Opacity: Select the intensity/opacity of traces.
• Trace Outline Scale: Select the thickness of traces.
• Feeder Highlight Opacity: Select the opacity/intensity of non-selected feeders, when Feeder Highlighting is applied.
• Conductor Dashing Mode: Conductor line styles can be applied to indicate phasing or overhead/underground
• Underground Cables: Display underground conductors with dashed lines.
• Phase Count Dashes: Display number of phases as dashes.
• None: Do not display underground cable dashing or phase count dashes.
• Rotate Device Symbols: Display device symbols in the same orientation or aligned with the network.
• Device Labels Always to the Right: When selected, displays device labels to the right of the device.
• Show Selection Panel when Item is Selected: When selected, displays the Selection panel for the device. (When deselected the panel is not shown by default, but can be shown by clicking  on the Map toolbar or by selecting the same option from the selected device’s right click menu).
on the Map toolbar or by selecting the same option from the selected device’s right click menu).• Do Not Move Map When Panels Open: When selected, as Map panels are displayed the Map does not move to accommodate the panel.
• Inertial Panning: When selected, the Map exhibits “momentum” after panning with the mouse or finger.
• Smoothly Animate Between Positions: When selected, the Map smoothly pans and zooms between different positions; for example when clicking Back or Forward, when targeting on nearby events, or displaying the extent of a trace.
• Auto-reset to Default Selection Mode: When selected, returns to the default Map selection mode. (For example, after switching to Measure Distance mode or Geographic Location mode)
After changing settings in this panel, click OK to apply the changes, or click Defaults to restore the factory settings.
The changes you apply here will be saved with your User Preferences the next time you log on.
Understanding Pan and Zoom Actions
Pan and zoom uses the same technique as many other widely available online Map applications.
• To pan the Map, click and hold the left mouse button, then drag the mouse pointer to a new position.
• To zoom the Map, roll the mouse wheel away from you to zoom in or toward you to zoom out.
• To zoom to show an area of the map, click and hold the middle mouse button, then drag to define the area you wish to view, then release the mouse button. This will zoom in and pan to center the area at the highest zoom possible that can show the requested area of the map.
When using on a touch enabled device, use your finger to pan the map and the pinch gesture to zoom in or out.
Understanding Common Symbols
Symbols commonly displayed in Flex Operations provide additional situational awareness. The following list describes some symbols you may see in the Map.
• Outage Symbols represent the predicted or confirmed location of devices that have operated. They are automatically removed when the outage is restored.
• Crew Symbols show the intended location of Crews. Crew symbols are displayed when the crew is en route or onsite at an outage event, and removed when the crew is released.
• Call Symbols show the location of customers who have called to report an outage. They are automatically removed when the outage is restored.
• Notes are used to annotate network assets, or can be placed on the Map background.
• Tags can be added and removed by suitably authorized Users.
• Damage Assessments and Patrolling Conditions can also be added and removed by suitably authorized users.
Map Menu Options
File Menu
The File menu allows you to print the map view or close the map tab/window.
• Print
The Print option allows you to print the Map with what devices and conditions are currently visible (using the current Hide/Display options).
• Select Print from the Map's File menu. The map area will be displayed in preview mode. You can pan and zoom in the Print Preview view to change the area of the map to print.
Click the Print Selected Region button ( ) to view the Print view where you can select a printer to print to or save as a PDF.
) to view the Print view where you can select a printer to print to or save as a PDF. To cancel without printing, click the Cancel Print button ( ).
).
).• Exit: Closes the Map window
View Menu
Options available here provide different views of the electrical network:
• Color by Feeder: When selected, colors the network feeder by feeder.
• Color by Phase: When selected, colors the network by phase.
• Color by Nominal Voltage: When selected, colors the network by nominal voltage.
• Color Secondary by Fixed Color: When selected, all secondary network will show with the configured fixed secondary color.
• Color Secondary by State: When selected, secondary networks that have state related styles will be styled according to the state. Any secondary network that is in a nominal state will show the configured fixed secondary color.
• Color Secondary by State and Mode: Similar to the Color Secondary by State option, but the nominal state conductors will follow the Feeder/Phase/Voltage coloring mode, just like non-secondary conductors.
• Show Nominal Network State: When selected, displays the nominal state of devices and conductors.
• Declutter Symbols: When selected, declutters the network when zoomed out.
• Map Color Legend: Displays the Map Color Legend dialog, which illustrates the colors, highlights, and line styles for the different electrical states, phases, and voltages.
• Show Diagnostics Panel: Displays a panel allowing access to Map configuration and analysis (not displayed for most User types).
Map Hide/Display Options
The Hide/Display menu allows you to select what devices or map components to show or hide. The options are:
• Hide / Display
• Landbase: Toggle the visibility of the landbase (if one is selected in the Settings panel).
• Secondary: Toggles the visibility of the secondary network
• Structures: Toggles the visibility of structures such as poles
• Non-Main Asset DA: Toggles the visibility of non-main asset damage report symbols.
• Customer Calls: Toggles the visibility of customer calls.
• Annotations
• Conductor Current Phase Markers: Toggles the visibility of phase indicators on conductors.
• Device Labels: Toggles the visibility of device labels
• Device Nominal Phase Labels: Toggles the visibility of devices’ nominal phase(s). If a device is in an abnormal state the background of the label is colored green (abnormally open) or red (abnormally closed).
• Conductor Nominal Phase Labels: Toggles the visibility of conductors’ nominal phase(s). If a conductor is in an abnormal state the background of the label is colored green (abnormally de-energized) or red (abnormally energized).
• Conductor Feeder Labels: Toggles the visibility of conductor feeder labels.
• Flow Direction: Toggles the visibility of flow direction arrows.
• Crews Types
• All
• Line
• Trouble
• Guide
• Service
• Eval
• Tree Crew
• Conductor Highlight
• Assessed
• Predicted De-Energized
• Confirmed De-Energized
• Confirmed Degraded
See “Hiding and Displaying Viewer Objects” for more information.
Using the Map's Back and Forward Buttons
The map toolbar Back ( ) and Forward (
 ) buttons allow you to go back or forward to recently viewed positions on the map. The history is stored whenever the Map is stationary for a couple of seconds. Up to 50 map positions can be stored in history.
) and Forward () buttons allow you to go back or forward to recently viewed positions on the map. The history is stored whenever the Map is stationary for a couple of seconds. Up to 50 map positions can be stored in history.When smooth animation between positions is enabled, there may be some occasions where you want to skip the animation and proceed directly to the target. Selecting the skip animation option ( ) performs that action.
) performs that action.Note: Alternatively, to skip the animation, you can press G on your keyboard.
Searching and Positioning
You can search on assets, customers, and other type of map object.
1. Click the Search button ( ) to open the Map Search dialog box.
) to open the Map Search dialog box.2. Choose the Search Type from the drop‑down list.
3. Enter the text to search for.
4. Select a wildcard option, if applicable.
5. Click the Search button to execute the search:
Search button to execute the search:• If there is only one match, the dialog box will close and the Map will reposition.
• If there are multiple matches, they will be displayed in the Search Results panel that is displayed below the map. If the search result exactly matched the entered text, it will be highlighted and positioned automatically.
Using the Distance Measurement Tool
You can measure distances on the Map:
1. In the Map toolbar, click the measurement tool ( ).
).
).2. Click in the map to add a start position.
3. Move to a different position and click again to create a turning point.
4. Double-click or click on the last point to complete the measurement. The distance is displayed in the top-right corner of the Map.
5. Click anywhere in the Map to remove the measurement.
Using the Geographic Location Tool
You can click on a map location to get the geographic co-ordinates:
1. In the Map toolbar, click  .
.
.2. Click in the Map at the desired location. The geographic co-ordinates are displayed in the top-right corner of the Map.
3. If required, copy the co-ordinates to the clipboard.
4. Click anywhere in the Map to remove the co-ordinates.
Displaying Tooltips
You can display hover-over tooltips:
1. In the Map toolbar, click  .
.
.2. Mouse over a device, conductor, or symbol to reveal more information.
To keep the tooltip displayed, move the mouse pointer over the tooltip while it is still displayed. The information displayed depends on the type of object.
Selecting and Interacting with Map Objects using the Selection Panel
When you select a device or symbol, it will be highlighted or outlined in yellow [1]. The Selection Panel will be displayed [2] when the Selection Panel icon is toggled on [3]. Device operations are available through right-click context menus [4].

The Selection Panel is a combination tool providing actions and information that are found in multiple tools in the NMS operations client (for example, the Control Tool).