JMX Based Monitoring
With the advent of Java Management Extensions (JMX) technology into base java, it is possible to use the technology to monitor and manage java infrastructure from a JSR160 compliant JMX compliant console (or JMX browser). Whilst the JEE components of the product can use basic JMX statistics such as Memory usage, Threads, Class information and VM summary information, there are application specific JMX classes added to the product to allow greater levels of information to be display and additional operations.
The Oracle Utilities Application Framework has implemented a set of product specific JMX classes on the Web Application Server and Business Application Server tiers of the architecture to allow the following:
• Management of the cache of the Web Application Server. See Server Cache for more details of this cache.
• Collection of JVM information and performance statistics for memory, thread usage and operating system level information. Most of these are extensions of java.lang.management classes.
• Collection of service based performance information for SLA tracking on the Business Application Server.
To use this facility the facility must be configured and enabled to allow the collection of the relevant information. This can be done at installation time by using the following configuration settings:
Configuration Setting | Deployment Details |
|---|---|
WEB_JMX_RMI_PORT_PERFORMANCE | Port Number used for JMX based management for Web Application Server. |
ouaf.jmx.splwls g.base.support. management.mbean.JVMInfo | Globally enable or disable JVMInfo Mbean (setting in spl.properties). Default is enabled. |
ouaf.jmx.com.splwg.base.web.mbeans .FlushBean | Globally enable or disable FlushBean Mbean (setting in spl.properties). Default is enabled. |
ouaf.jmx.com.oracle.ouaf.uws.mbeans .WSFlushBean | Globally enable or disable WSFlushBean Mbean (setting in spl.properties). Default is enabled. |
BSN_JMX_RMI_PORT_PERFORMANCE | Port Number used for JMX based management for Business Application Server. |
ouaf.jmx.com.splwg.ejb.service.management. PerformanceStatistics | Globally enable or disable PerformanceStatistics Mbean (setting in spl.properties). Default is enabled. |
BSN_JMX_SYSUSER | Default JMX Userid for both Web Application Server and Business Application Server |
BSN_JMX_SYSPASS | Default JMX Password for both Web Application Server and Business Application Server. |
BATCH_RMI_PORT | Port Number used for JMX based management for background processing. |
WEB_BATCH_CLUSTER_URL | Cluster URL override to be used for JMX based management for background processing. This can manually be set to identity an administration node for processing. |
These settings are registered in the ENVIRON.INI (see ENVIRON.INI - Environment Configuration File) for setting in the relevant configuration files. It is important that the values used for these port numbers are unique across all environments within a machine. The security used for these ports are defined as outlined in JMX Security.
Web Application Server JMX Reference
Once configured a JMX client (for example, jconsole) can be used to connect to the JMX information using the following Remote Connection string:
service:jmx:rmi:///jndi/rmi://<host>:<jmx_port>/oracle/ouaf/webAppConnector
and
service:jmx:rmi:///jndi/rmi://<host>:<jmx_port>/oracle/ouaf/iwsConnector
Where:
<host> | The Web Application Server host name |
<jmx_port> | The JMX Port specified using WEB_JMX_RMI_PORT_PERFORMANCE for the online and WEB_JMX_RMI_PORT_PERFORMANCE for Inbound Web Services from the ENVIRON.INI (see ENVIRON.INI - Environment Configuration File) configuration file. |
The credentials provided to the JMX console are as configured in JMX Security. Upon successful connection to the JMX port and host with the correct credentials provides access to the Mbean information. The figure below illustrates a successful connection to the JMX Mbeans using jconsole as an example: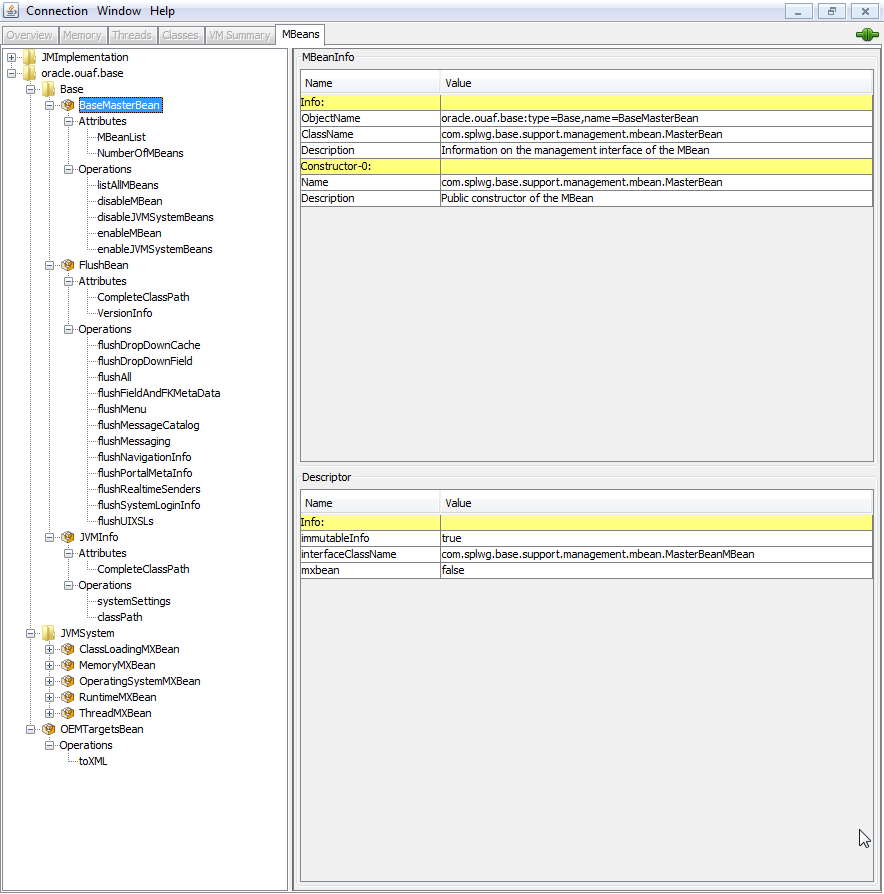

The structure of the Mbean is shown by the figure below: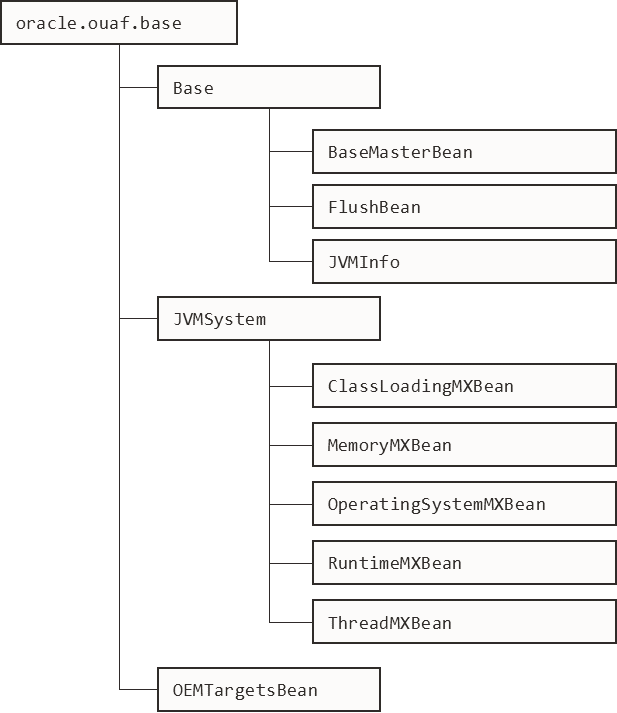

The following table summarizes the Mbean attributes and operations for the Web Application Server:
Mbean | Usage |
|---|---|
BaseMasterBean | Master MBean |
Attributes | |
NumberOfMbeans | Returns the number of active Mbeans. |
MBeanList | Returns an array with the list of Mbeans defined to this Master Mbean. |
Operations | |
disableMbean | Disables Mbean with designated name as a par. |
enableMbean | Enables Mbean with designated name. |
disableMbean | Returns a list with the list of Mbeans defined to this BaseMasterBean. Names can be programmatically used to supply parameters to disableMbean and enableMbean. |
enableJVMSystemBeans | Enables base JVM system Mbeans. |
disableJVMSystemBeans | disables base JVM system Mbeans. |
FlushBean/WSFLushBean | Manages Online/IWS Cache |
Attributes | |
VersionInfo | Returns string of base version number of Mbean. |
CompleteClassPath | Returns classpath name of Mbean. |
Operations | |
flushAll | Reset all elements in online data cache. |
flushDropDownCache | Resets cached elements of the online drop-down lists in online data cache. |
flushDropDownField | Resets drop-down fields in online data cache (Development use only). |
flushFieldAndFKMetaData | Resets Field and Foreign Key Meta Data in online data cache. |
flushMenu | Reset Menu items in online data cache. |
flushMessageCatalog | Reset field labels in online data cache. |
flushMessaging | Reset messages in online data cache. |
flushNavigationInfo | Reset navigation information in online data cache. |
flushPortalMetaInfo | Reset portal and zone information in online data cache. |
flushSystemLoginInfo | Reset security information in online data cache. |
flushUIXSLs | Reset user interface style sheets in online data cache. |
JVMInfo | JVM Information Mbean |
Attributes | |
CompleteClassPath | Displays the class path of the JVMInfo Mbean |
Operations | |
classPath | Returns the full classpath used by the online JVM |
systemSettings | Returns the attributes of the JVM for debugging and support purposes. |
JVMSystem | JVM Mbean (Java base metrics) |
ClassLoadingMXBean | Class Loading JVM Mbean |
Attributes | |
LoadedClassCount | Returns the number of classes that are currently loaded in the JVM. |
ObjectName | The ObjectName for uniquely identifying the MXBean for the class loading system within an MBeanServer. In this case it is set to java.lang:type=ClassLoading. |
TotalLoadedClassCount | Returns the total number of classes that have been loaded since the JVM was last started. |
UnloadedClassCount | Returns the total number of classes unloaded since the Java virtual machine has started execution. |
Verbose | Enables or disables the verbose output for the class loading system. Default is false (disabled). |
MemoryMXBean | Memory JVM Mbean |
Attributes | |
HeapMemoryUsage | Returns the current memory usage of the heap that is used for object allocation. Initial, Committed, Maximum and Used memory statistics are provided for Heap memory. |
NonHeapMemoryUsage | Returns the current memory usage of non-heap memory that is used by the JVM. Initial, Committed, Maximum and Used memory statistics are provided for Non-Heap memory. |
ObjectPendingFinalization | Returns the approximate number of objects for which finalization is pending (used for diagnosing memory leaks). |
ObjectName | The ObjectName for uniquely identifying the MXBean for the memory system within an MBeanServer. In this case it is set to java.lang:type=Memory |
Verbose | Enables or disables the verbose output for the memory system. Default is false (disabled). |
Operations | |
gc | Initiates garbage collection. |
Notifications | |
javax.management.Notification | Used for low memory notifications. Notification Types supported: (java.management.memory.threshold .exceeded, java.management.memory .collection.threshold.exceeded) |
OperatingSystemMXBean | Operating System Mbean |
Attributes | |
MaxFileDescriptorCount | Returns the File Descriptor Maximum Limit in force on the JVM. |
OpenFileDescriptorCount | Returns the number of Open File Descriptors currently used by JVM. |
CommittedVirtualMemorySize | Returns the amount of committed virtual memory (that is, the amount of virtual memory guaranteed to be available to the running process). |
FreePhysicalmemorySize | Returns the total amount of free physical memory. |
FreeSwapSpaceSize | Returns the total amount of free swap space. |
ProcessCpuTime | Returns the amount of process CPU time consumed by the JVM. |
TotalPhysicalMemorySize | Returns the total amount of physical memory. |
TotalSwapSpaceSize | Returns the total amount of swap space. |
Name | Returns the operating system name. |
Version | Returns the version of the operating system. |
Arch | Returns the operating system architecture. |
AvailableProcessors | Returns the number of available processors to the JVM. |
SystemLoadAverage | Returns the system load average for the last minute. |
Name | Returns the name representing the running JVM. The returned name string can be any arbitrary string and a JVM implementation can choose to embed platform-specific useful information in the returned name string. Each running virtual machine could have a different name. |
ClassPath | Returns the Java class path that is used by the system class loader to search for class files. |
ObjectName | The ObjectName for uniquely identifying the MXBean for the operating system within an MBeanServer. In this case it is set to java.lang:type= OperatingSystem |
RuntimeMXBean | Java Runtime MBean |
Attributes | |
Starttime | Returns the start time of the Java virtual machine in milliseconds. This method returns the approximate time when the JVM started. |
ManagementSpecVersion | Returns the version of the specification for the management interface implemented by the running JVM. |
VmName | Returns the Java virtual machine implementation name. |
VmVendor | Returns the Java virtual machine implementation vendor. |
VmVersion | Returns the Java virtual machine implementation version. |
SpecName | Returns the Java virtual machine specification name. |
SpecVendor | Returns the Java virtual machine specification vendor. |
SpecVersion | Returns the Java virtual machine specification version. |
LibraryPath | Returns the Java library path. |
BootClassPath | Returns the boot class path that is used by the bootstrap class loader to search for class files. |
Uptime | Returns the uptime of the Java virtual machine in milliseconds. |
BootClassPathSupported | Tests if the JVM supports the boot class path mechanism used by the bootstrap class loader to search for class files. Returns false if not supported; true if supported. |
InputArguments | Returns the input arguments passed to the JVM which does not include the arguments to the main method. This method returns an empty list if there is no input argument to the JVM. Typically, not all command-line options to the 'java' command are passed to the Java virtual machine. Thus, the returned input arguments may not include all command-line options. |
SystemProperties | Returns a map of names and values of all system properties. |
ThreadCount | Returns the current number of live threads including both daemon and non-daemon threads. |
PeakThreadCount | Returns the peak live thread count since the JVM started or peak was reset. |
TotalStartedThreadCount | Returns the total number of threads created and also started since the JVM started. |
DaemonThreadCount | Returns the current number of live daemon threads. |
ThreadContentionMonitoringSupported | Tests if the JVM supports thread contention monitoring. Returns false if not supported; true if supported. |
ThreadContentionMonitoringEnabled | Enables or disables thread contention monitoring. Set to false to disable; true to enable. |
CurrentThreadCpuTime | Returns the total CPU time for the current thread in nanoseconds. The returned value is of nanoseconds precision but not necessarily nanoseconds accuracy. If the implementation distinguishes between user mode time and system mode time, the returned CPU time is the amount of time that the current thread has executed in user mode or system mode. |
CurrentThreadUserTime | Returns the CPU time that the current thread has executed in user mode in nanoseconds. The returned value is of nanoseconds precision but not necessarily nanoseconds accuracy. |
ThreadCpuTimeSupported | Tests if the JVM supports CPU time measurement for the current thread. Returns false if not supported; true if supported. |
ThreadCpuTimeEnabled | Enables or disables thread CPU time measurement. The default is platform dependent. Set to false to disable; true to enable. |
CurrentThreadCpuTimeSupported | Tests if the Java virtual machine supports CPU time measurement for the current thread. Returns false if not supported; true if supported. |
ObjectMonitorUsageSupported | Tests if the Java virtual machine supports monitoring of object monitor usage. Returns false if not supported; true if supported. |
SynchronizerUsageSupported | Tests if the JVM supports monitoring of ownable synchronizer usage. Returns false if not supported; true if supported. |
AllThreadIds | Returns all live thread IDs. Some threads included in the returned array may have been terminated when this method returns. |
ObjectName | The ObjectName for uniquely identifying the MXBean for the java runtime within an MBeanServer. In this case it is set to java.lang:type=Runtime. |
Operations | |
dumpAllThreads | Returns the thread info for all live threads with stack trace and synchronization information. Some threads included in the returned array may have been terminated when this method returns. • Locked Monitors - if true, dump all locked monitors • Locked Synchronizers - if true, dump all locked ownable synchronizers |
findDeadlockedThreads | Finds cycles of threads that are in deadlock waiting to acquire object monitors or ownable synchronizers. Threads are deadlocked in a cycle waiting for a lock of these two types if each thread owns one lock while trying to acquire another lock already held by another thread in the cycle. |
getThreadCpuTime | Returns the total CPU time for a thread of the specified ID in nanoseconds. The returned value is of nanoseconds precision but not necessarily nanoseconds accuracy. If the implementation distinguishes between user mode time and system mode time, the returned CPU time is the amount of time that the thread has executed in user mode or system mode. |
getThreadInfo | Returns the thread info for a thread of the specified id with no stack trace. |
getThreadInfo | Returns the thread info for each thread whose ID is in the input array ids with no stack trace. |
getThreadInfo | Returns thread information for a thread of the specified id, with stack trace of a specified number of stack trace elements. The maxDepth parameter indicates the maximum number of StackTraceElements to be retrieved from the stack trace. This method does not obtain the locked monitors and locked synchronizers of the thread. |
getThreadInfo | Returns the thread information for each thread whose ID is in the input array ids, with stack trace of a specified number of stack trace elements. The maxDepth parameter indicates the maximum number of StackTraceElements to be retrieved from the stack trace. This method does not obtain the locked monitors and locked synchronizers of the threads. |
getThreadInfo | Returns the thread info for each thread whose ID is in the input array ids, with stack trace and synchronization information. This operation obtains a snapshot of the thread information for each thread including: • The entire stack trace. • The object monitors currently locked by the thread if lockedMonitors is true. • The ownable synchronizers currently locked by the thread if lockedSynchronizers is true. |
getThreadUserTime | Returns the CPU time that a thread of the specified ID has executed in user mode in nanoseconds. |
resetPeakThreadCount | Resets the peak thread count to the current number of live threads. |
OEMTargetsBean | Application Management Pack for Oracle Utilities interface |
Operations | |
toXML | Generate Target information for Oracle Enterprise Manager. An XML document with information for the Application Management Pack for Oracle Utilities. |
Business Application Server JMX Reference
Once configured a JMX client (for example, jconsole) can be used to connect to the JMX information for the business application server using the following remote connection string:
service:jmx:rmi:///jndi/rmi://<host>:<jmx_port>/oracle/ouaf/ejbAppConnector
Where:
<host> | The host name for the business application server. |
<jmx_port> | The JMX Port specified using BSN_JMX_RMI_PORT_PERFORMANCE from the ENVIRON.INI (see ENVIRON.INI - Environment Configuration File) configuration file. |
The credentials provided to the JMX console are as configured in JMX Security. Upon successful connection to the JMX port and host with the correct credentials provides access to the Mbean information. The figure below illustrates the successful connection to the JMX Mbeans using jconsole as an example: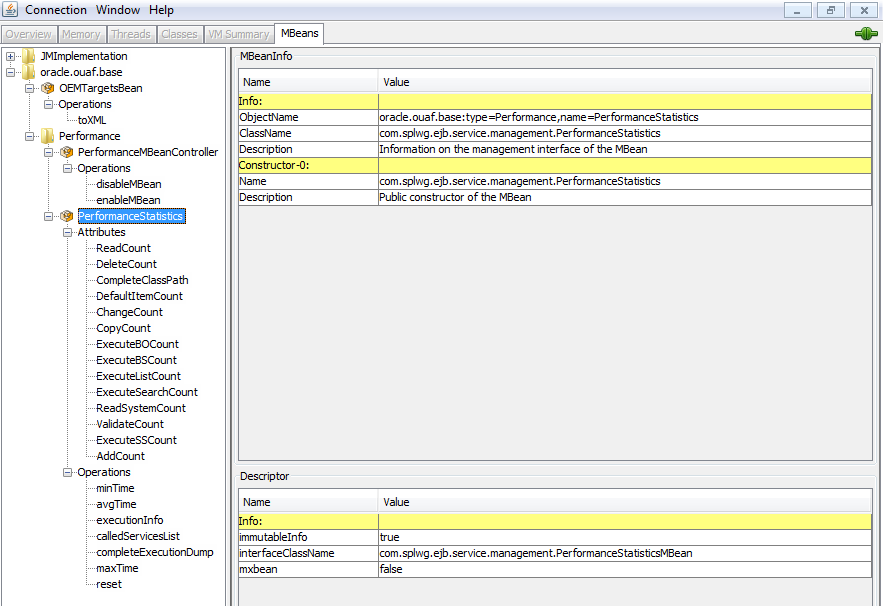

The structure of the Mbean is shown in the figure below: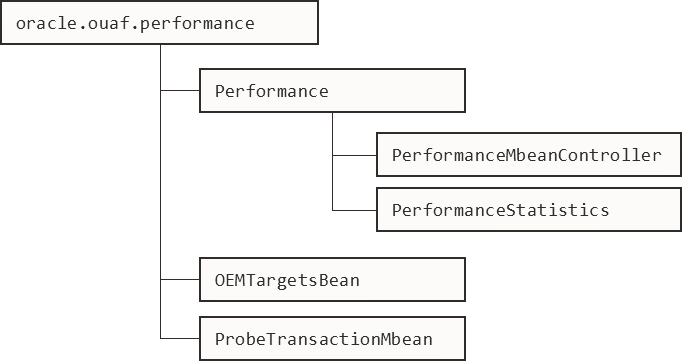

The following table outlines the Mbean attributes and operations for the business application server:
Mbean | Usage |
|---|---|
PerformanceMbeanController | Performance Mbean Controller |
Operations | |
disableMbean | Disables PerformanceStatistics Mbean. |
enableMbean | Enables PerformanceStatistics Mbean. |
PerformanceStatistics | Performance Statistics |
Attributes | |
ReadCount | Returns number of executed read object calls since last reset or last time collection enabled. |
DeleteCount | Returns number of executed delete object calls since last reset or last time collection enabled. |
ChangeCount | Returns number of executed change object calls since last reset or last time collection enabled. |
AddCount | Returns number of executed add object calls since last reset or last time collection enabled. |
DefaultItemCount | Returns number of executed calls to default the object values since last reset or last time collection enabled. |
ExecuteBOCount | Returns number of calls to Business Objects since last reset or last time collection enabled. |
ExecuteBSCount | Returns number of calls to Business Services since last reset or last time collection enabled. |
ExecuteListCount | Returns number of calls to the list based services since last reset or last time collection enabled. |
ExecuteSearchCount | Returns number of calls to the search based services since last reset or last time collection enabled. |
ReadSystemCount | Returns number of calls to Oracle Utilities Application Framework system Objects since last reset or last time collection enabled. |
ValidateCount | Returns number of calls to Validate Objects since last reset or last time collection enabled. |
ExecuteSSCount | Returns number of calls to Service Scripts since last reset or last time collection enabled. |
Operations | |
CompleteClassPath | Returns the class path used for the Mbeans. |
reset | Resets statistical values. See Resetting Statistics for more advice on this operation. |
maxTime | Returns maximum (worst case) time, in ms, for the designated service since the last reset or last time collection enabled. |
minTime | Returns minimum (best case) time, in ms, for the designated service since the last reset or last time collection enabled. |
completeExecutionDump | Returns complete statistics for all services executed since the last reset or last time collection enabled. See Execution Dump Format for details of format. |
avgTime | Returns average time, in ms, for the designated service since the last reset or last time collection enabled. |
executionInfo | Returns complete statistics for the designated service executed since the last reset or last time collection enabled. See Execution Dump Format for details of format. |
calledServices | Returns list of services and service types since the last reset or last time collection enabled. See Service Lists for details of format. |
ProbeTransactionMbean | Component Probe |
Operations | |
checkApplicationServer | Constructs HTTP/HTTPS request and returns RFC 2616 HTTP response code and response time in ms. |
checkDatabaseConnectivity | Executes SQL SELECT to test database connectivity. Returns response time in ms. |
checkBusinessApplicatioServer | Executes base service (read only) to return application server performance in ms. |
OEMTargetsBean | Application Management Pack for Oracle Utilities interface |
Operations | |
toXML | Generate Target information for Oracle Enterprise Manager. An XML document with information for the Application Management Pack for Oracle Utilities. |
Note: The times quoted in the statistics only record times experienced from the business application server down to the data and back. They do not include network time to the web application server, any time spent by the web application server, network time to the browser client or browser rendering times. The business application server time represents the typical majority of the time spent in a transaction.
Batch JMX Reference
Once configured a JMX client (for example, jconsole) can be used to connect to the JMX information for the business application server using the following Remote Connection string:
service:jmx:rmi:///jndi/rmi://<host>:<jmx_port>/oracle/ouaf/batchConnector
Where:
<host> | A batch server host name. |
<jmx_port> | The JMX Port specified using BATCH_RMI_PORT from the ENVIRON.INI (see ENVIRON.INI - Environment Configuration File) configuration file. |
Note: In a multi-host environment, it is possible to reserve a specific host/port combination using the WEB_BATCH_CLUSTER_URL which specifies a specific host and BATCH_RMI_PORT combination as the administration machine.
The credentials provided to the JMX console are as configured in JMX Security. Upon successful connection to the JMX port and host with the correct credentials provides access to the Mbean information. The figure below illustrates the successful connection to the JMX Mbeans using jconsole as an example: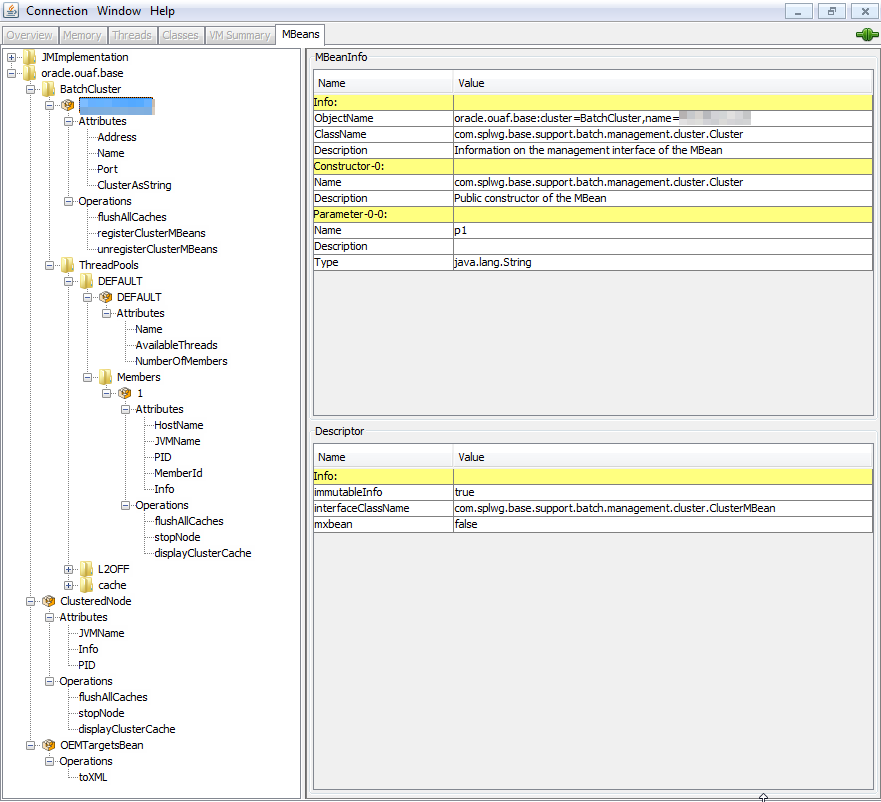

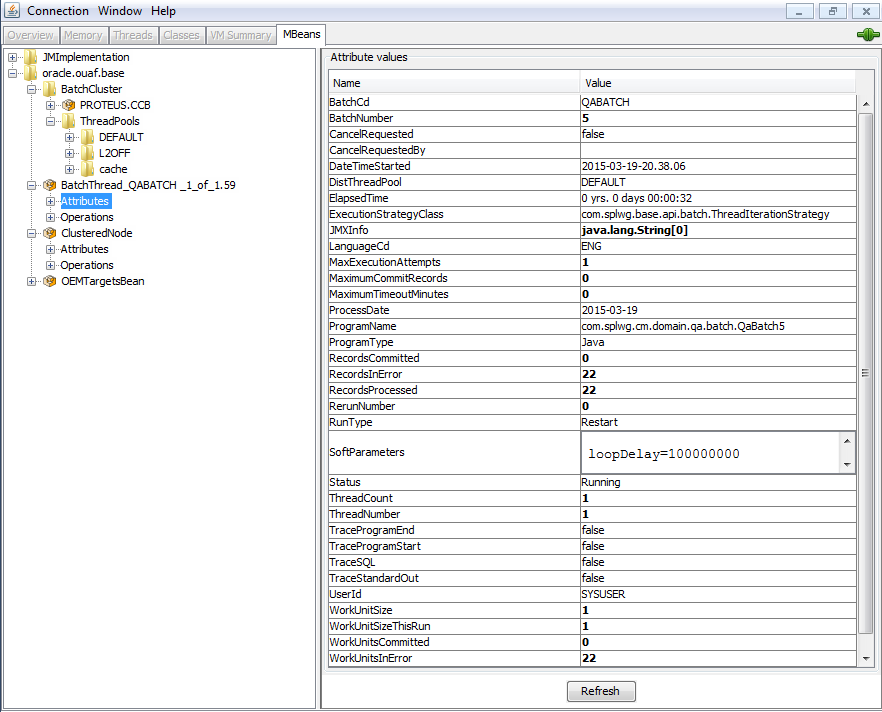
The structure of the Mbean is shown in the figure below: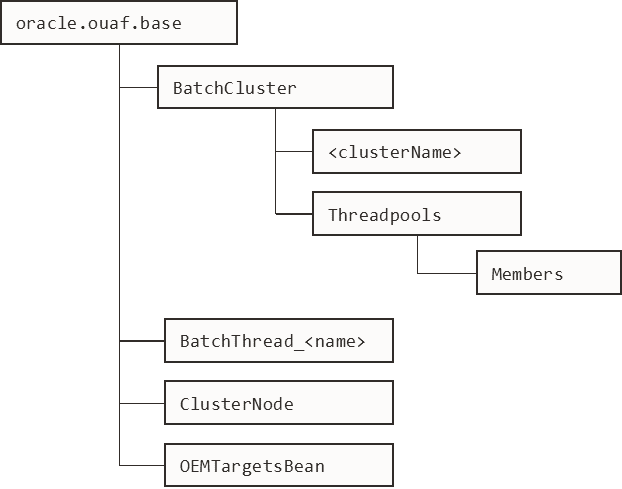

The following table outlines the Mbean attributes and operations for the business application server:
Mbean | Usage |
|---|---|
BatchCluster | Cluster Mbean for cluster with name <ClusterName> |
Attributes | |
Address | Cluster address as specified in COHERENCE_CLUSTER_ADDRESS - Multicast address for Batch Cluster in ENVIRON.INI |
Name | Name of Cluster as specified in COHERENCE_CLUSTER_NAME - Batch Cluster Name in ENVIRON.INI |
Port | Port number assigned to Cluster as specified in COHERENCE_CLUSTER_PORT - Batch Cluster Port Number in ENVIRON.INI |
ClusterAsString | XML representation of the cluster for use with Application Management Pack for Oracle Utilities. The structure represents the hierarchy of JMX calls in XML format. |
Operations | |
flushAllCaches | Flush the data reuse cache across the batch cluster. Invoke this operation to reload configuration data changes for batch jobs. |
registerClusterMBeans | Register the Mbeans for lower level tracking. This needs to be invoked to allow threadpool and batch thread level tracking. |
unregisterClusterMBeans | Disable lower level tracking. This stops low level tracking. |
ThreadPools | Threadpool Statistics (an entry per threadpool) Note: This tree will only appear if registerClusterMbeans is executed to enable the additional metrics. |
Attributes | |
Name | Name of the threadpool. |
AvailableThreads | Number of spare threads for batch processes. A value of zero (0) indicates the threadpool is at capacity. Note: For cache or administration threadpools, this value is always zero (0). |
NumberOfMembers | Number of members/hosts defined to the threadpool. A value of zero (0) indicates a cache or administration threadpool. |
Members | Member (submitters/nodes) statistics |
Attributes | |
Hostname | Name of Host hosting this threadpool instance. |
JVMName | Name of JVM assigned at runtime. |
PID | Unique OS Process Id for JVM. |
MemberId | Member Number. This number of unique across the cluster and is used to track the member internally by the framework. |
Info | Parameters used to start threadpool instance in free format. This is primarily used by Application Management Pack for Oracle Utilities. |
Operations | |
flushAllCaches | Flush the cache for this instance. |
stopNode | Stop this member. This allows members to be stopped manually. |
displayClusterCache | Cluster Cache in free format. This is primarily used by Application Management Pack for Oracle Utilities. |
ClusterNode | Member information about the member you are connected to |
Attributes | |
JVMName | Name of JVM assigned at runtime. |
PID | Unique OS Process Id for JVM. |
Info | Parameters used to start threadpool instance in free format. This is primarily used by Application Management Pack for Oracle Utilities. |
Operations | |
flushAllCaches | Flush the cache for this instance. |
stopNode | Stops this member. This allows members to be stopped manually. |
displayClusterCache | Cluster Cache in free format. This is primarily used by Application Management Pack for Oracle Utilities. |
BatchThread/BatchJob | Batch Thread/Job Metrics Note: BatchThreads is spawned per thread. BatchJob is spawned for jobs with multiple threads as a control node. BatchJob will not be spawned for single thread jobs. |
Attributes | |
BatchCd | Batch Code. |
BatchNumber | Batch Number. |
CancelRequested | True if the thread has been asked to stop running. See CancelReqeustedBy. |
CancelRequestedBy | If CancelRequested=true, this will be a string indicating the workstation from where the cancellation was requested. This value will also be logged to the Batch Run Tree. |
DateTimeStarted | The date and time the batch process was started. |
DistThreadPool | The thread pool to which this batch process belongs. |
ElapsedTime | How long the batch process has been running in Java format. |
ExecutionStrategyClass | This indicates the commit strategy followed by the program. |
JMXInfo | Additional Tags for batch thread. |
LanguageCD | Language Code used for execution for messages. |
MaxExecutionAttempts | MAX-ERROR value. |
MaximumCommitRecords | Commit Interval for Timeouts (Legacy Support only). |
MaximumTimeoutMinutes | Timeout Interval (Legacy Support only). |
ProcessDate | Business Date. |
ProgramName | The program name executed. This is set on the Batch Controls. |
ProgramType | The program type. Value is typically: Java |
RecordsCommitted | The number of record updates that have been committed to the database. See the note below this table for details. |
RecordsInError | The number of records so far in error. This is what will be logged to the Batch Run Tree. See the note below this table for details. |
RecordsProcessed | The number of records processed so far. This is what will be logged to the Batch Run Tree. See the note below this table for details. |
RerunNumber | Rerun Number if RunType is Rerun. |
RunType | The type of run: New Run, Restart or Rerun. |
SoftParameters | List of job parameters from Batch Controls. |
Status | Current status of the thread. Valid values are: Initializing (at the start of execution to the call to getJobWork in the application class); Getting Work means it is currently in the process of selecting the work units for the batch process; Got Work means it is has successfully selected the work and is in the process of initiating the threads. |
ThreadCount | Thread Limit. |
ThreadNumber | Thread Number. |
TraceProgramEnd | Whether tracing for Program End is enabled. |
TraceProgramStart | Whether tracing for Program Start is enabled. |
TraceSQL | Whether SQL statement tracing is enabled. |
TraceStandardOut | Whether output tracing is enabled. |
UserId | User used for authorization. |
WorkUnitSize | The total number of work units for this batch process. For new and restarted runs, this will always contain the total number of work units as selected in the getJobWork method when the batch process was originally started. |
WorkUnitSizeThisRun | This is the number of work units for this particular run. For a restarted run, this value will typically be less than the above value; otherwise they will be the same. |
WorkUnitsCommitted | The number of work units that have had their work committed. |
WorkUnitsInError | The work units that have been found to be in error so far. |
WorkUnitsProcessed | The work units that have been processed so far. |
Operations | |
cancelThread | Cancels this thread. This updates CancelRequested and CancelRequestedBy. Information is persisted on the Batch Run Tree. |
OEMTargetsBean | Application Management Pack for Oracle Utilities interface |
Operations | |
toXML | Generates target information for Oracle Enterprise Manager. An XML document with information for the Application Management Pack for Oracle Utilities. |
Note: Each batch thread is uniquely identifiable in the BatchThread JMX call with the name <mbean>.<batchcd>.<thread>_of_<threadlimit>.<javathread>. Where <mbean> is BatchJob or BatchThread, <batchcd> is the batch control identifier for the job, <thread>_of_<threadlimit> is the thread within thread limit and <javathread> is the internal lava thread number.
Note: The Records numbers are what will be used to log to the Batch Run Tree, and they are usually in step with the WorkUnit values. The reason they are shown separately is because it is possible for custom background processes manually manipulate the record counts for the Batch Run Tree. The true progress status of a thread is reflected in the WorkUnit counts.
JMX Security
By default, when JMX is enabled for either the Web Application Server, Web Service and Business Application Server then a default JMX configuration using simple security is implemented as outlined in http://java.sun.com/javase/6/docs/technotes/guides/management/agent.html.
The simple security system consists of two files that control the access permissions and passwords specified by default for the installation:
Configuration Setting | Location of file | Template |
|---|---|---|
Password File | scripts/ouaf.jmx.password.file | ouaf.jmx.password.file.template |
Access Control File | scripts/ouaf.jmx.access.file | ouaf.jmx.access.file.template |
These files are built by the initialSetup utility using the templates indicated. Refer to the templates or generated files for valid values. The format of these files is dictated by http://java.sun.com/javase/6/docs/technotes/guides/management/agent.html#gdeup.
Note: By default, the passwords stored in these files are in encrypted text. Alternative security schemes are allows as documented in the link above. This will require custom templates (see Implementing Custom Templates) and changes to specific files to implement.
Extending JMX Security
Whilst the base installation of Oracle Utilities Operational Device Management uses the basic level of security there are ways of extending the current security:
• If the default security scheme is sufficient for your needs then additional users may be manually added using the user exits see (User Exit Include Files) for the above files.
• For production it is recommended to implement an SSL based solution as outlined in http://docs.oracle.com/javase/6/docs/technotes/guides/management/agent.html.
Refer to Oracle Utilities Operational Device Management Security Guide for more schemes available for this process.
Execution Dump Format
In previous versions (V1.x) of the Oracle Utilities Application Framework based products, it was possible to extract performance information from the Business Application Server using a logging based method using the Oracle Tuxedo txrpt utility. This facility was useful in tracking performance of individual services over time to detect non-compliance against Service Level Agreement targets. With the advent of later versions of the Oracle Utilities Application Framework, the need for Oracle Tuxedo was removed but there was a need for performance information to be collated.
In the latest version of the Oracle Utilities Application Framework, it is possible to track performance information using JMX to process externally to check performance and check compliance against Service Level Agreements.
To extract the information from Oracle Utilities Operational Device Management, the following needs to be done:
• Use a JMX browser (or JMX console) product to connect to the Business Application Server JMX port using the appropriate credentials.
• Invoke the completeExecutionDump operation from the PerformanceStatistics Mbean. This is will return a Comma separated values, with field names in the header record, containing the performance data which can be transferred to the clipboard (or whatever format supported by the JMX client). The format of the CSV is shown in the table below:
Column | Comment |
|---|---|
ServiceName | Name of the service. |
ServiceType | Type of service or action (see Service Lists for valid values). |
MinTime | Minimum service time, in ms, since last reset. |
MaxTime | Maximum service time, in ms, since last reset. |
Avg Time | Average service time, in ms, since last reset. |
# of Calls | Number of calls to service since last reset. |
Latest Time | The service time of the latest call, in ms. |
Latest Date | The date of the latest service call (in format: YYYY-MM-DD::hh-mm-ss-sss). |
Latest User | The userid of the user who issued the latest call. |
• (Optionally) Invoke the reset operation from the PerformanceStatistics Mbean to reset the statistics for the next collection period. Refer to Resetting Statistics for a discussion of this task.
This information can then be post processed in an appropriate analysis tool to determine appropriate actions.
Note: The statistics are active as long the Mbean is enabled or the system is active. Shutting down the Business Application Server with collection of the data may cause data loss for the statistics.
Service Lists
The JMX Performance Mbeans collect information about application services that have been executed during the collection period. This information can be obtained using the calledServices operation which returns a list of called services and their valid actions (summarized actions that have been called) in the format:
<servicename> [<valid action>]
Where:
<servicename> | Name of Service |
<valid actions> | List of valid actions recorded for the service. The table below lists the valid values. |
Valid Action | Comment |
|---|---|
ADD | Service is attempting adding a new instance of an object to the system. For example, adding a to do record. |
CHANGE | Service is attempting changes to an existing object in the system. |
DEFAULT_ITEM | Service is resetting its values to defaults. For example, by pressing the Clear button on Oracle Utilities Operational Device Management UI toolbar. |
DELETE | Service is attempting to delete an existing object. |
EXECUTE_BO | Service is a business object. |
EXECUTE_BS | Service is a business service. |
EXECUTE_LIST | Service is a list based service. |
EXECUTE_SEARCH | Service is a search. |
EXECUTE_SS | Service is a service script (including BPA scripts). |
READ | Service is attempting to retrieve an object from the system. |
READ_SYSTEM | Service is a common Oracle Utilities Application Framework based service. |
VALIDATE | Service is issuing a validation action. |
Resetting Statistics
The performance statistics collected represent values since the application was started or when it has been reset. Collection of statistics, without reset, can adversely influence the effectiveness of the statistics over time. It is therefore recommended to reset the statistics on a regular basis (after they are collected for example).
This can be achieved using the reset operation from the PerformanceStatistics Mbean to effectively zero or blank out the collection statistics.
For example, if the statistics are to be collected on an hourly basis then the reset should occur after the data collection happens per hour.
Note: Any statistics collected during the actual reset operation will not be reflected in the statistics. This situation should have minimal impact on overall statistics.