Day by Day and Hourly Breakdown Module
The Day By Day and Hourly Breakdowns module displays these breakdowns one after the other. Refer to each section to learn about each breakdown.
Requirements and Limitations
Requirements and limitations are as follows:
- Web Portal Data: Data shown in the Oracle Utilities web portal may be inconsistent with Weekly Energy Update data. The daily usage values (or, if the customer is eligible to receive it, daily cost values) in the Day by Day breakdown do not always match the exact values in the web portal due to the way the values are rounded or when the calculations are performed.
- Web Portal Access: The customer must have access to the Oracle Utilities web portal to be able to follow the link or to click the bar chart and be redirected to the data browser in the web portal.
- Rate Modeling: Utility rates must be modeled by Oracle Utilities for cost information to appear. If rates are not modeled, energy use information is displayed by default. If the utility chooses to display cost information, rate modeling is required during initial program setup for an additional fee. See the Oracle Utilities Opower Rates Engagement Cloud Service Product Overview for more information.
User Experience - Day by Day Breakdown
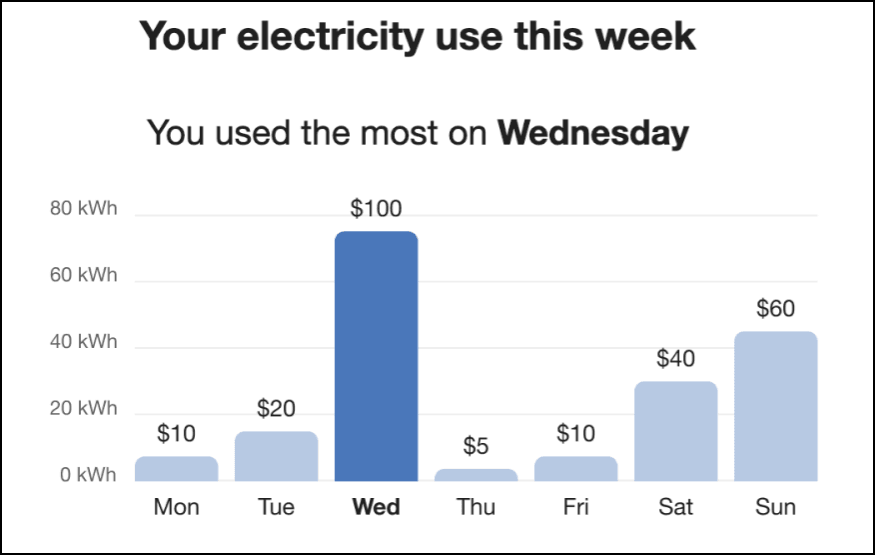
The Day by Day Breakdown shows how much energy the customer spent each day of the previous week. For electricity customers, the bars in the graph represent the total electricity consumed on the corresponding day, and the blue bar represents the day on which the most was used. If a customer's rates are modeled, the cost per day can be displayed below each bar in the graph. Dual fuel versions of the communication include graphs for both electricity and gas use.
The module includes these components:
Title: The title specifies a fuel type and the fact that the date range is for a week.
Insight: The insight below the title indicates the day on which the customer used the most energy. The goal of this insight is to encourage the customer to think of ways to avoid using as much energy on the same day in future weeks.
Bar Chart: The bar chart shows the amount of energy used on each day for the previous week. The bar chart starts on Monday and ends on Sunday of the previous week. Each bar represents a day, with the day of the week displayed under the bar. The larger the bar, the higher the customer's energy usage for that day. The feature also reveals each day's usage relative to the other days in the same week.
To highlight the day on which the customer used the most energy, the bar that represents the highest usage is displayed in blue. This makes visual identification of the customer's highest usage clear, even at a glance.

User Experience - Hourly Breakdown
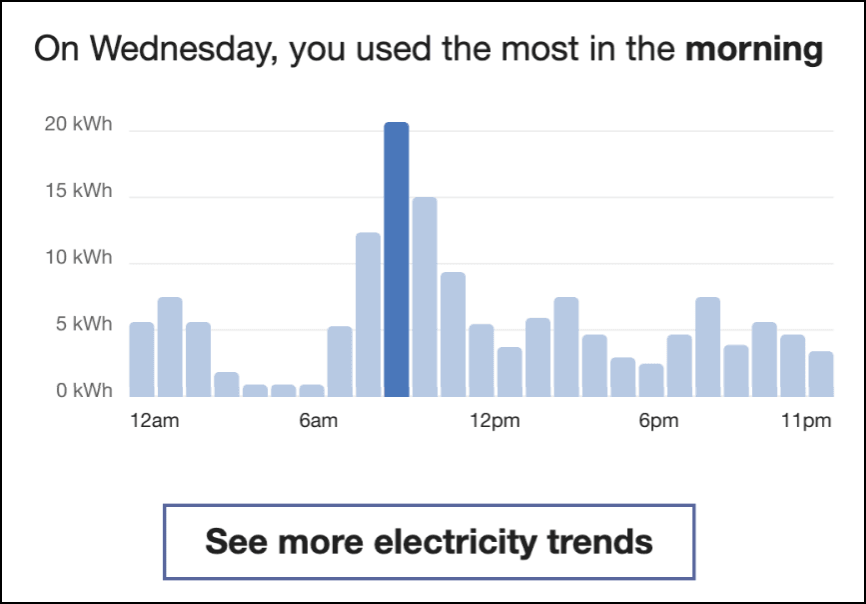
The Hourly Breakdown feature displays the hourly use for a customer's highest use day from the previous week. It allows customers to notice trends in their usage according to the time of day, which helps them identify ways they can save energy. Dual fuel versions of the communication include graphs for both electric and gas use.
The module has these components:
Insight Statement: An insight statement at the top of the module indicates the hours of the customer's highest usage day during which they used the most energy.
Bar Chart: The Hourly Breakdown displays a bar chart showing a customer's usage throughout the day for the day that they used the most energy. This makes it easy for the customer to compare their highest hourly usage to their lowest, to notice patterns in their usage, and to begin to form habits to change these usage patterns. The bar chart plots hourly usage over a 24 hour period, starting and ending with 12 AM.
This chart gives customers a visual representation of the times of day that they use the most energy, and makes it easy for them to compare their highest hourly usage to their lowest. By making this information clear to the customer, it becomes easier for them to notice patterns in their usage, and enables them to begin to form habits to change these usage patterns.
See More Trends Button: Clicking this link takes customers to the Data Browser in the Oracle Utilities Opower web portal. If the customer is not signed in to the web portal, they are prompted to either sign in to their account or register if they have not previously done so.
