15 Monitoring Dashboard
Monitoring dashboard has been provided to System integrators and IT administrators to review the health of the integrations. It displays data using different type of widgets to help users to assess the performance of integrations and identify the areas that requires attention.
This dashboard requires ‘routingHubAuditSummaryJob' job to be executed periodically using plato-batch-server.
TBelow are steps to schedule the job once cmc-obrh-services and plato-batch-server is UP and RUNNING:
- On Home screen, click Task Management. Under Task Management menu, click Configure Tasks.
- Select Schedule option.
- Select Task Name as routingHubAuditRetentionJob and Task Trigger Name will be generated automatically.
- Specify the CRON expression to daily EOD.
To resolve table space issue of Audit summary table, (CMC_RH_AUDIT_SUMMARY), Database Management Team has to configure database job to truncate table periodically basis.
Note:
Monitoring Dashboard will also be not available if Audit logs are turned off.- On Home screen, click Core
Maintenance. Under Core Maintenance menu,
click Routinh Hub. Under Routing Hub,
click Monitoring Dashboard
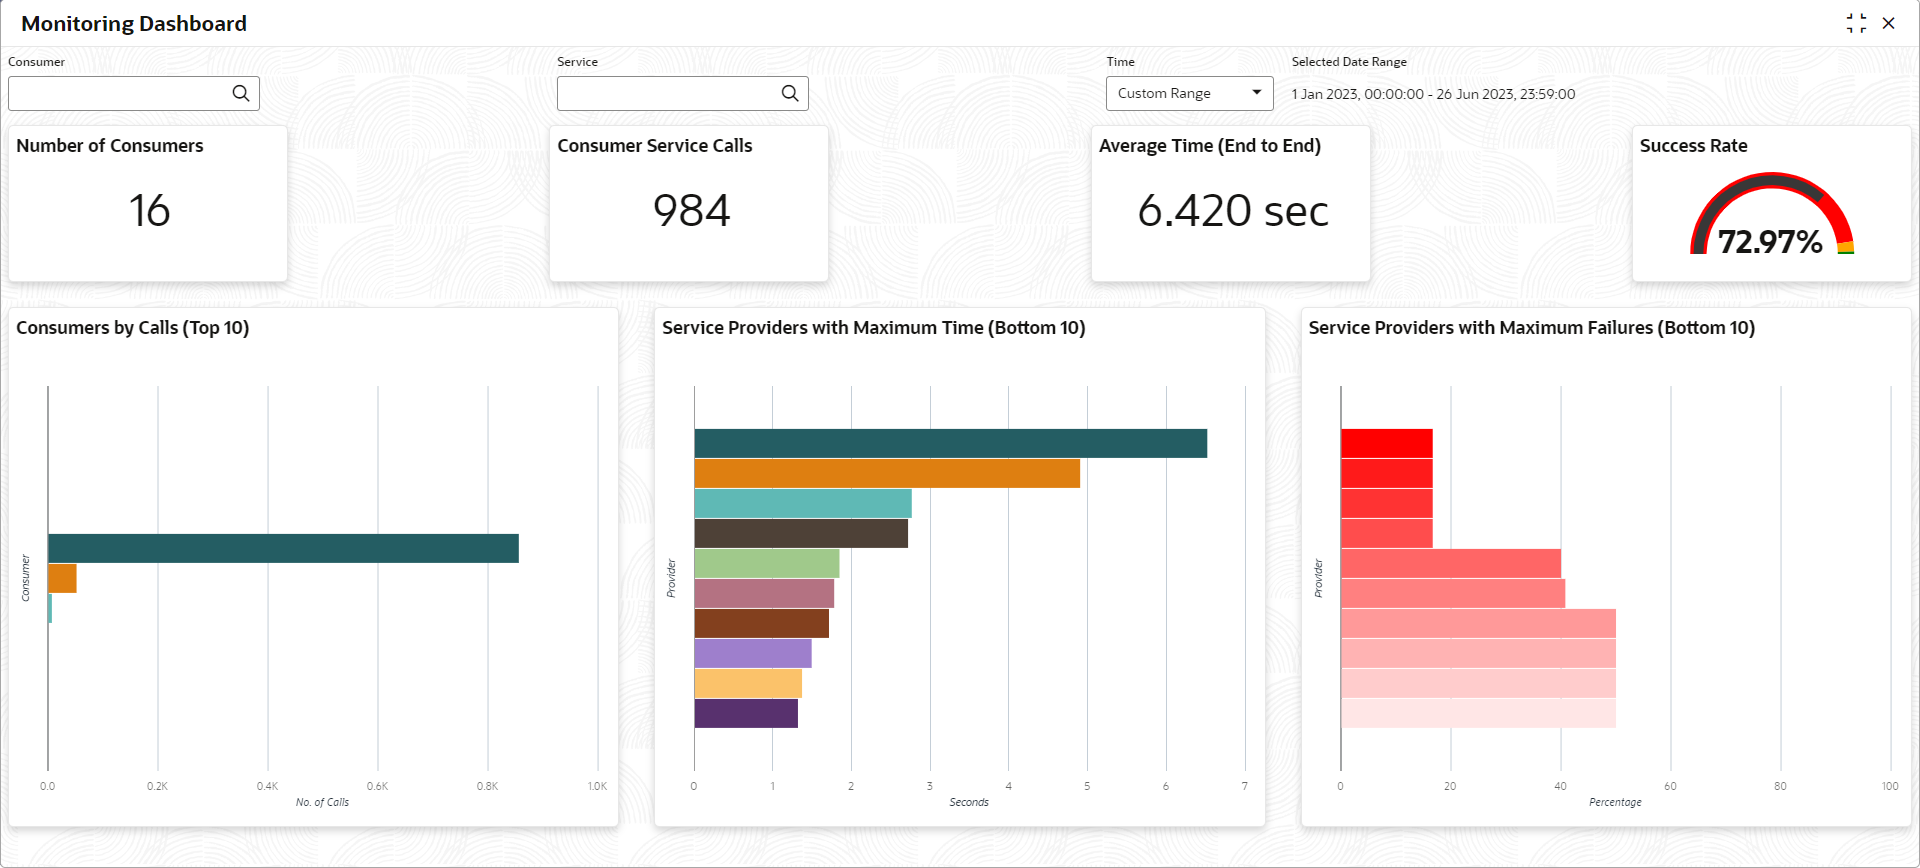
- Number of Consumers: This widget displays total number of consumers configured in the Oracle Banking Routing Hub.
- Consumer Service Calls: This widget displays total number of consumer services requested during chosen period.
- Average Time (End to End): This widget displays the average time (in seconds) taken to process successful requests, during chosen period.
- Success Rate: This widget provides an indicator of how many successful requests were made during chosen period.
- Consumers by Calls (Top 10): This widget provides a graphical display of the top 10 consumers based on requests they have made during chosen period. A link on the bar graph is provided to view further details of the Consumer.
- Service Providers with Maximum Time (Bottom 10): This widget provides a graphical display of bottom 10 providers based on the time taken to process requests, during s chosen period.
- Service Providers with Maximum Failures (Bottom 10): This widget provides a graphical display of bottom 10 providers based on failed requests, during s chosen period.
Consumer Page
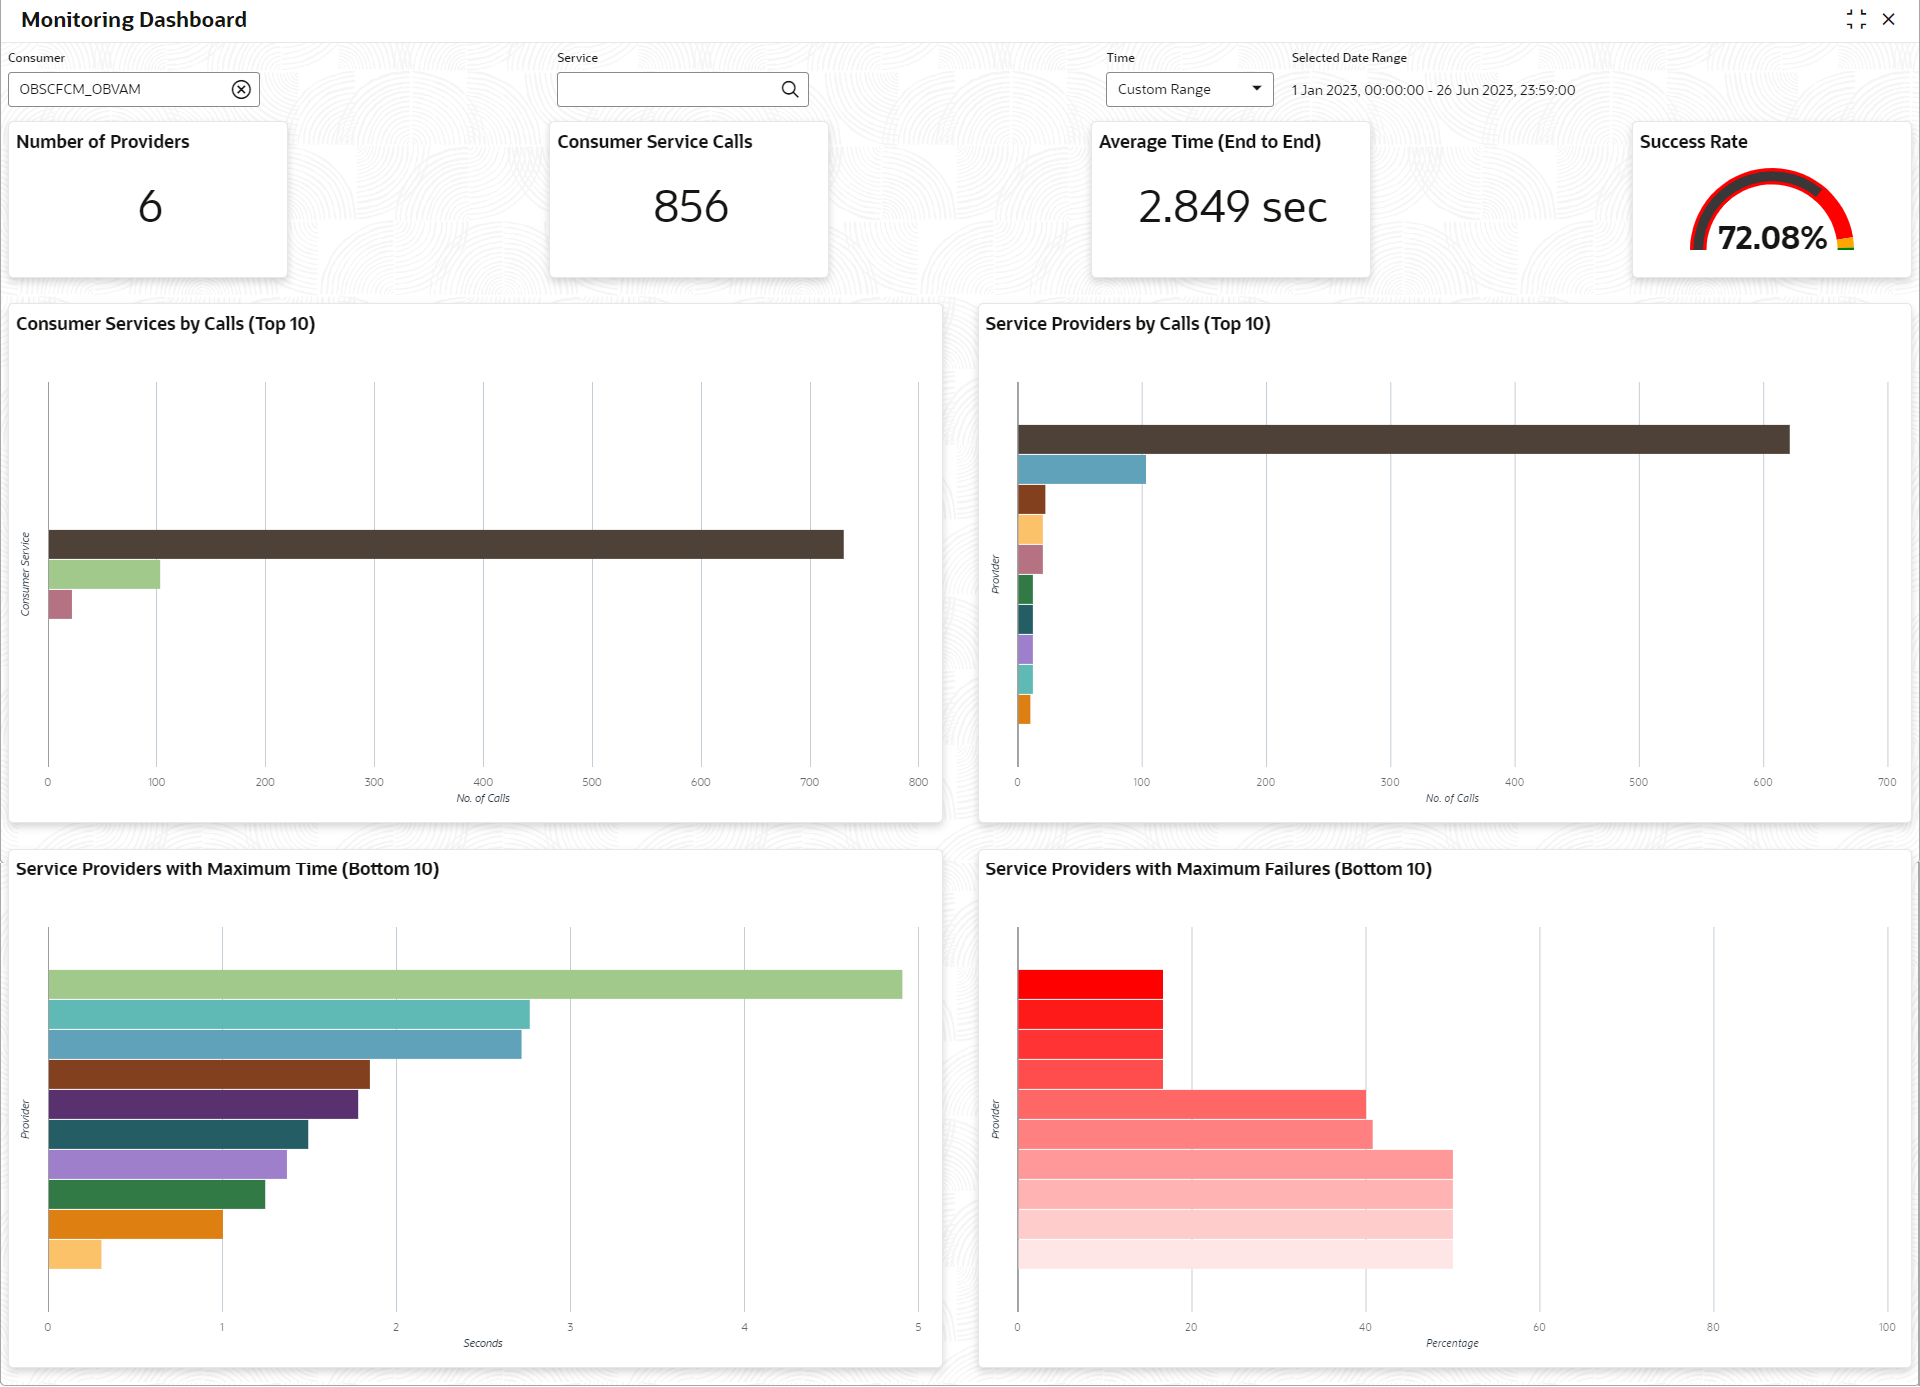
- Number of Providers: This widget displays the total number of service providers configured in Oracle Banking Routing Hub for the selected consumer.
- Consumer Service Calls: This widget displays total number of consumer services requested by the selected consumer during chosen period.
- Average Time (End to End): This widget displays the average time (in seconds) taken to process successful requests made by the selected consumer, during chosen period.
- Success Rate: This widget provides an indicator of how many successful requests were made by the selected consumer during chosen period.
- Consumer Services by Calls (Top 10): This widget provides a graphical display of the top 10 consumers Services during chosen period. A link on the bar graph is provided to view further details of the Consumer Service.
- Service Providers by Calls (Top 10): Shows top 10 service providers based on the maximum requests which are requested chosen period.
- Service Providers with Maximum Time (Bottom 10): Shows bottom 10 providers based on the maximum time taken to process successful requests which are requested during chosen period.
- Service Providers with Maximum Failures (Bottom 10): Shows bottom 10 providers based on the maximum number of failed requests which are requested during chosen period.
Consumer Service Page
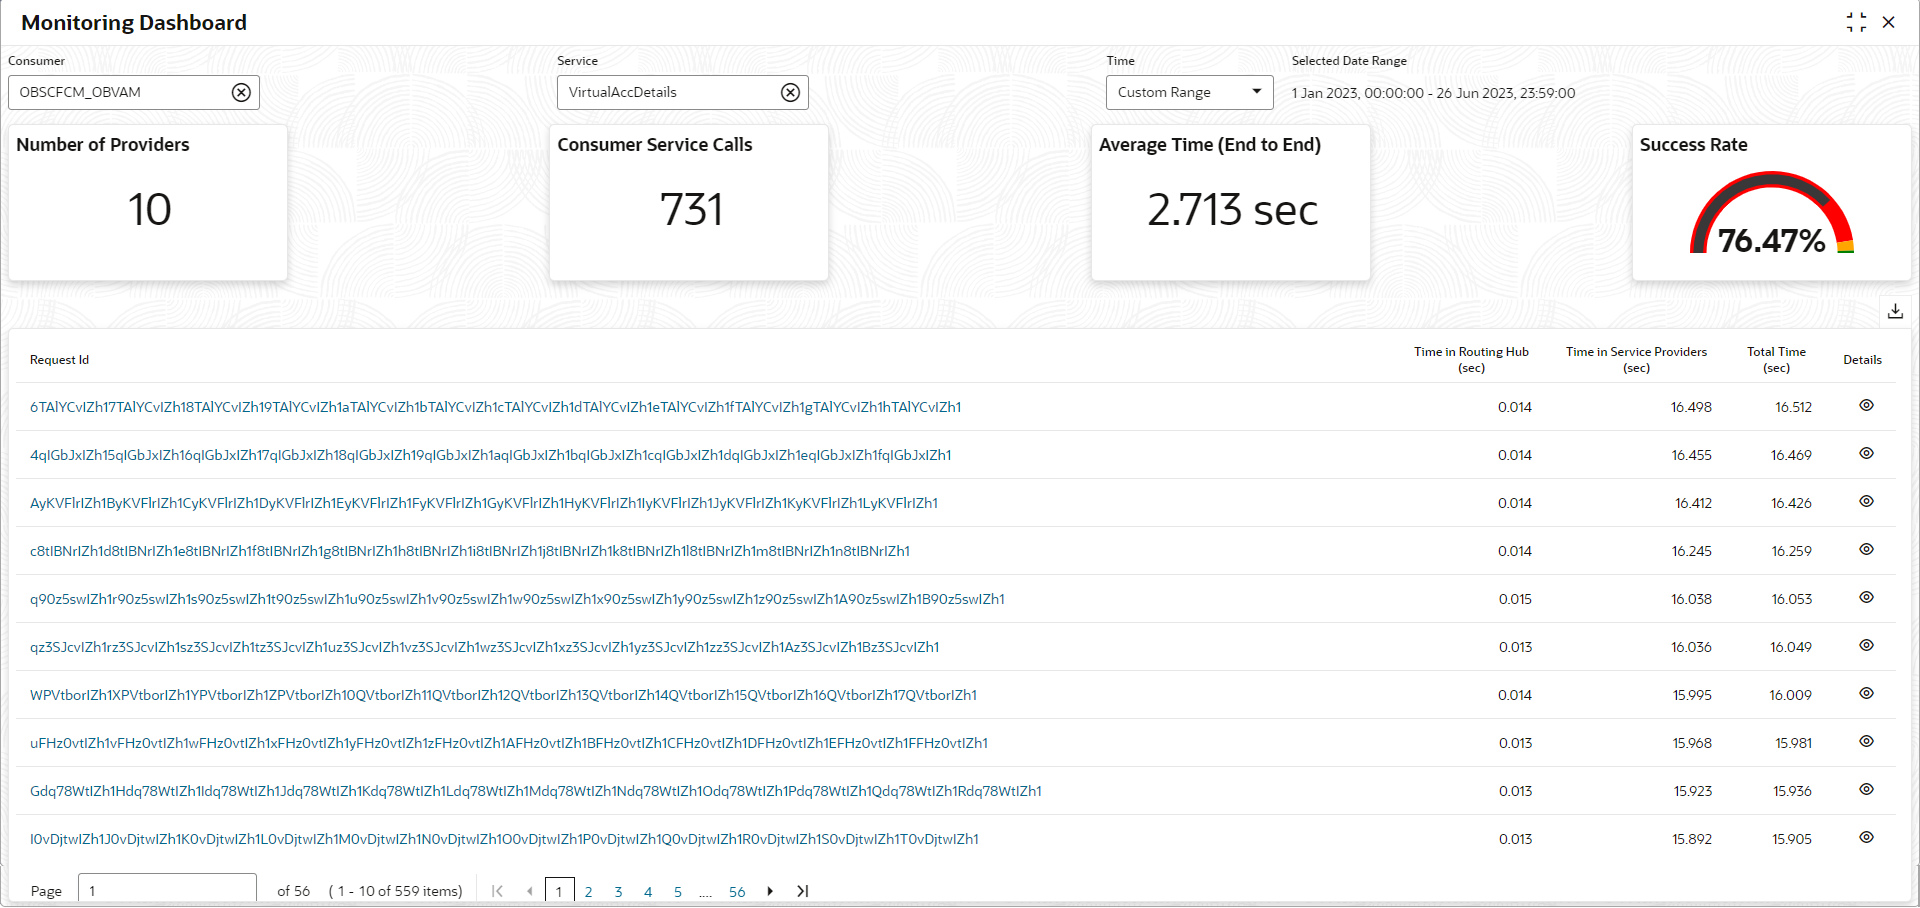
- Number of Providers: This widget displays total number of service providers to which this request is routed to complete the integration.
- Consumer Service Calls: This widget displays total number of consumer services made during chosen period.
- Average Time (End to End): This widget displays the average time taken to process successful requests made during chosen period.
- Success Rate: Shows the percentage of successful requests which are made during chosen period.
- Request Details: The table displays the list of requests which are
requested during chosen period. Following are the details which are provided
for each request.
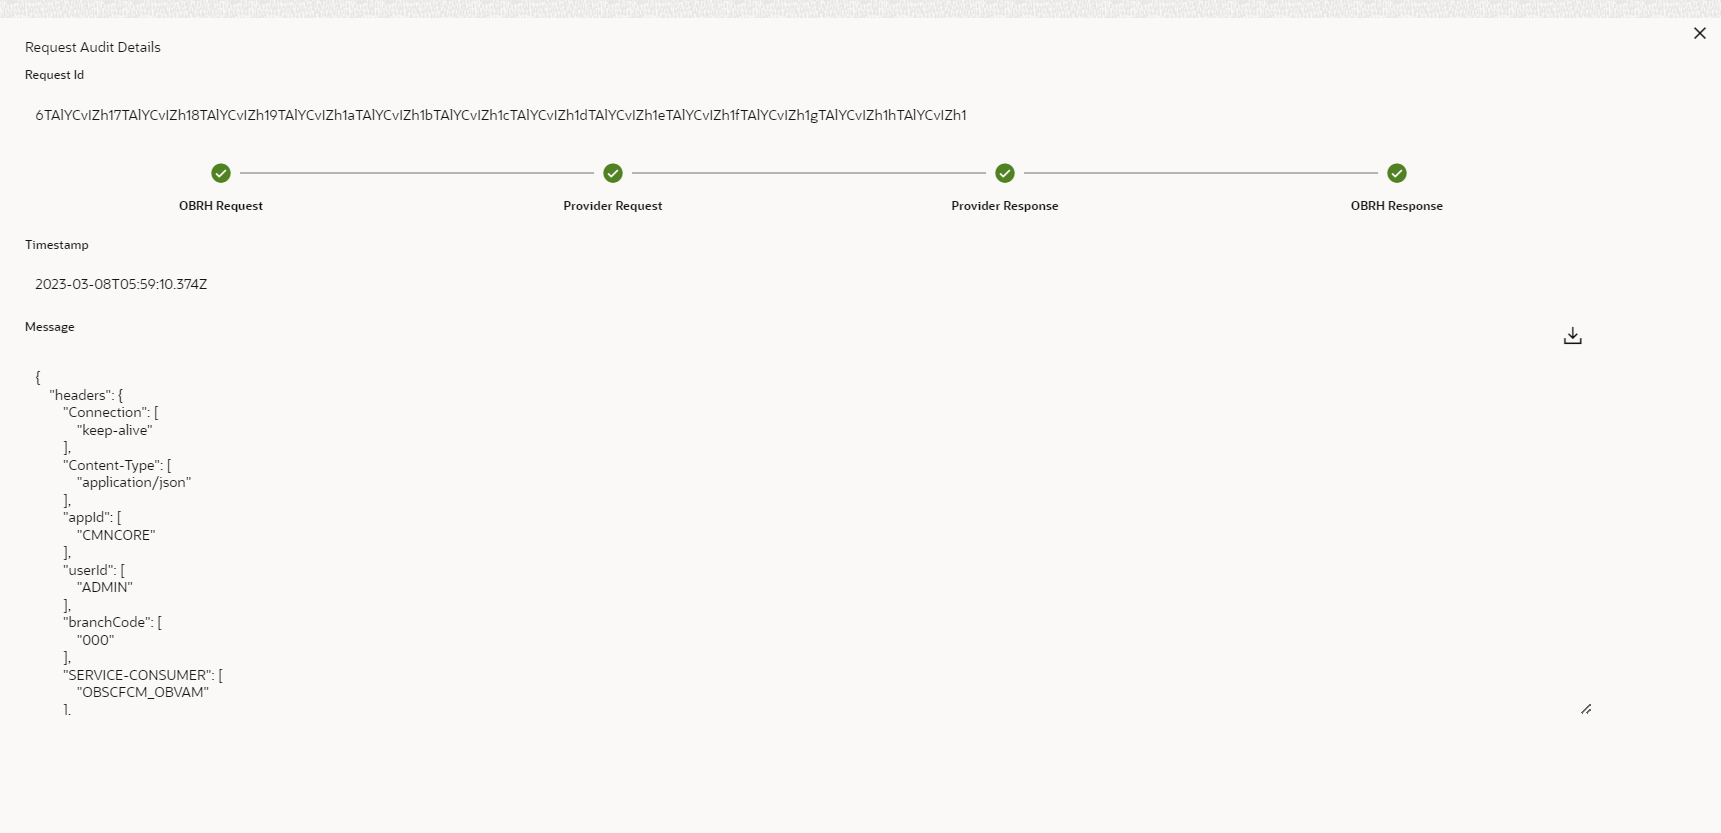
Component Name Component Type Request Id This is system generated reference number for each request. Click on the Request Id displays audit log information of the request. Time in Routing Hub (Sec) This field displays the time taken by Routing Hub (in seconds) to route the request between Consumer Service and Providers. Time in Service Providers (Sec) This field displays the total time taken by Service provides (in seconds) to process the request. Total Time (Sec) This field displays the total time to process the request Provider Service Text box Details Displays the tabular view of the time taken by individual providers (in case of chaining of the request)
| Component Name | Comments |
|---|---|
| Number of Providers | Shows total number of service providers. |
| Consumer Service Calls | Shows total number of consumer services requested during selected time. |
| Average Time (End to End) | Shows the average time taken to process successful requests which are requested during selected time. |
| Success Rate | Shows the percentage of successful requests which are requested during selected time. |
| Request Audit | Shows list of requests which are requested during selected time. |


