5 Troubleshooting OutOfMemory issues
This topic describes about Troubleshooting OutOfMemory issues
This topic contains the following subtopics:
- Extract Heapdump
This topic describes about the troubleshooting information to extract Heapdump. - JFR Tool in Java
This topic describes about JFR Tool in Java. - Quick Recovery
This topic provides the systematic instruction to troubleshoot the application for quick recovery.
5.1 Extract Heapdump
This topic describes about the troubleshooting information to extract Heapdump.
If there is an error like GC Overhead limit exceeded or OutOfMemoryException is thrown while starting the services, the following details need to be shared.
Heap Dump
A heap dump is a snapshot of objects that are in memory in the JVM at a certain timestamp in a transaction. Heap dumps help to troubleshoot memory-leak problems and optimize memory usage in microservices. Heap dumps are usually stored in binary format hprof files.
The HeapDumpOnOutOfMemoryError command-line option that generates a heap dump when a java.lang.OutOfMemoryError is thrown can be used to generate heap dumps:
java -XX:+HeapDumpOnOutOfMemoryError -XX:HeapDumpPath=<file-or-dir-path>
Alternatively, one can setup remote heap monitor to observe the memory leaks in the product. Perform the following steps:
- To enable jmx, set the following environment variable to start jmx:
- -Dcom.sun.management.jmxremote
- -Dcom.sun.management.jmxremote.port=8888
- -Dcom.sun.management.jmxremote.authenticate=false
- -Dcom.sun.management.jmxremote.ssl=false
Note:
If the above variable are set, a jmx service will start on specified port. - Setup JVisualVM as follows, to collect heap dumps:
- Start JVisualVM.
- Under "Remote" option, add a host.
- Under the new host, add new jmx connection.
Note:
With this setup, the JAVA process can be monitored remotely.
Parent topic: Troubleshooting OutOfMemory issues
5.2 JFR Tool in Java
This topic describes about JFR Tool in Java.
Java Flight Recorder (JFR) is a tool for collecting diagnostic and profiling data about a running Java application. It is integrated into the Java Virtual Machine (JVM) and causes almost no performance overhead, so it can be used even in heavily loaded production environments.
The below documentation provides steps to use JFRs to collect performance details and profiling data of services and can be used to report performance issues for OBMA services.
Parent topic: Troubleshooting OutOfMemory issues
5.3 Quick Recovery
This topic provides the systematic instruction to troubleshoot the application for quick recovery.
As a quick fix, try to restart the managed server or try to increase the memory allocated to the managed server.
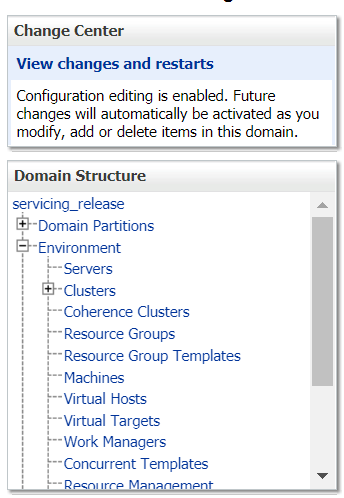
Perform the following steps to increase the memory:
Parent topic: Troubleshooting OutOfMemory issues


