2 Observability Improvements Logs using ELK Stack
This topic describes the troubleshooting procedures using the ELK Stack.
2.1 Setting up ELK Stack
This topic describes the systematic instruction to download, run and access the ELK Stack.
Download ELK Stack
2.1.1 Run ELK Stack
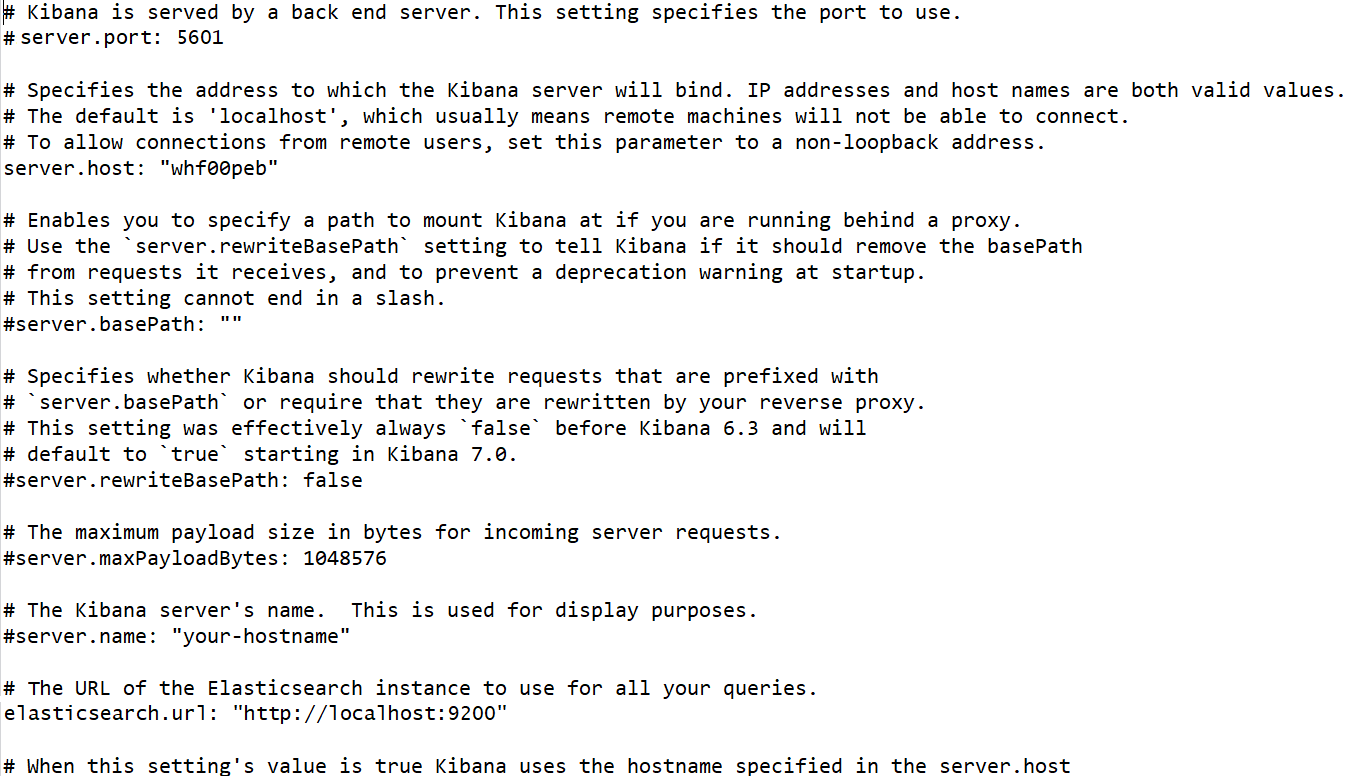
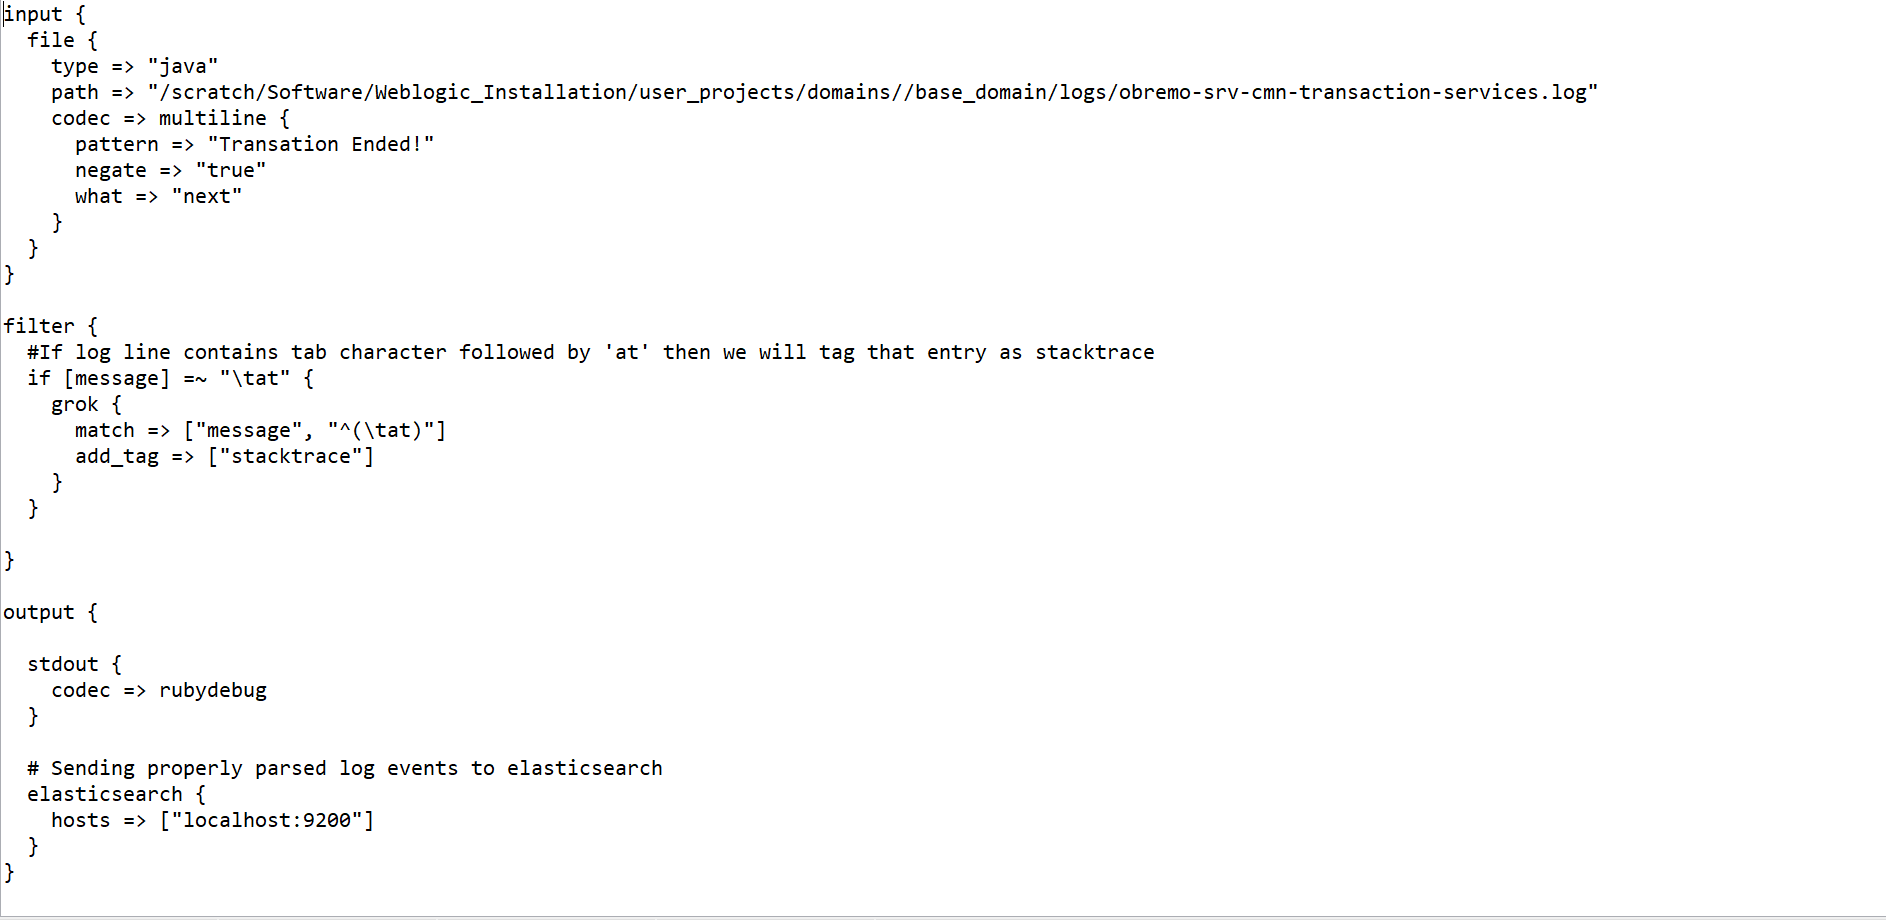
This topic describes the systematic instruction to run the ELK Stack.
Perform the following steps:
2.2 Kibana Logs
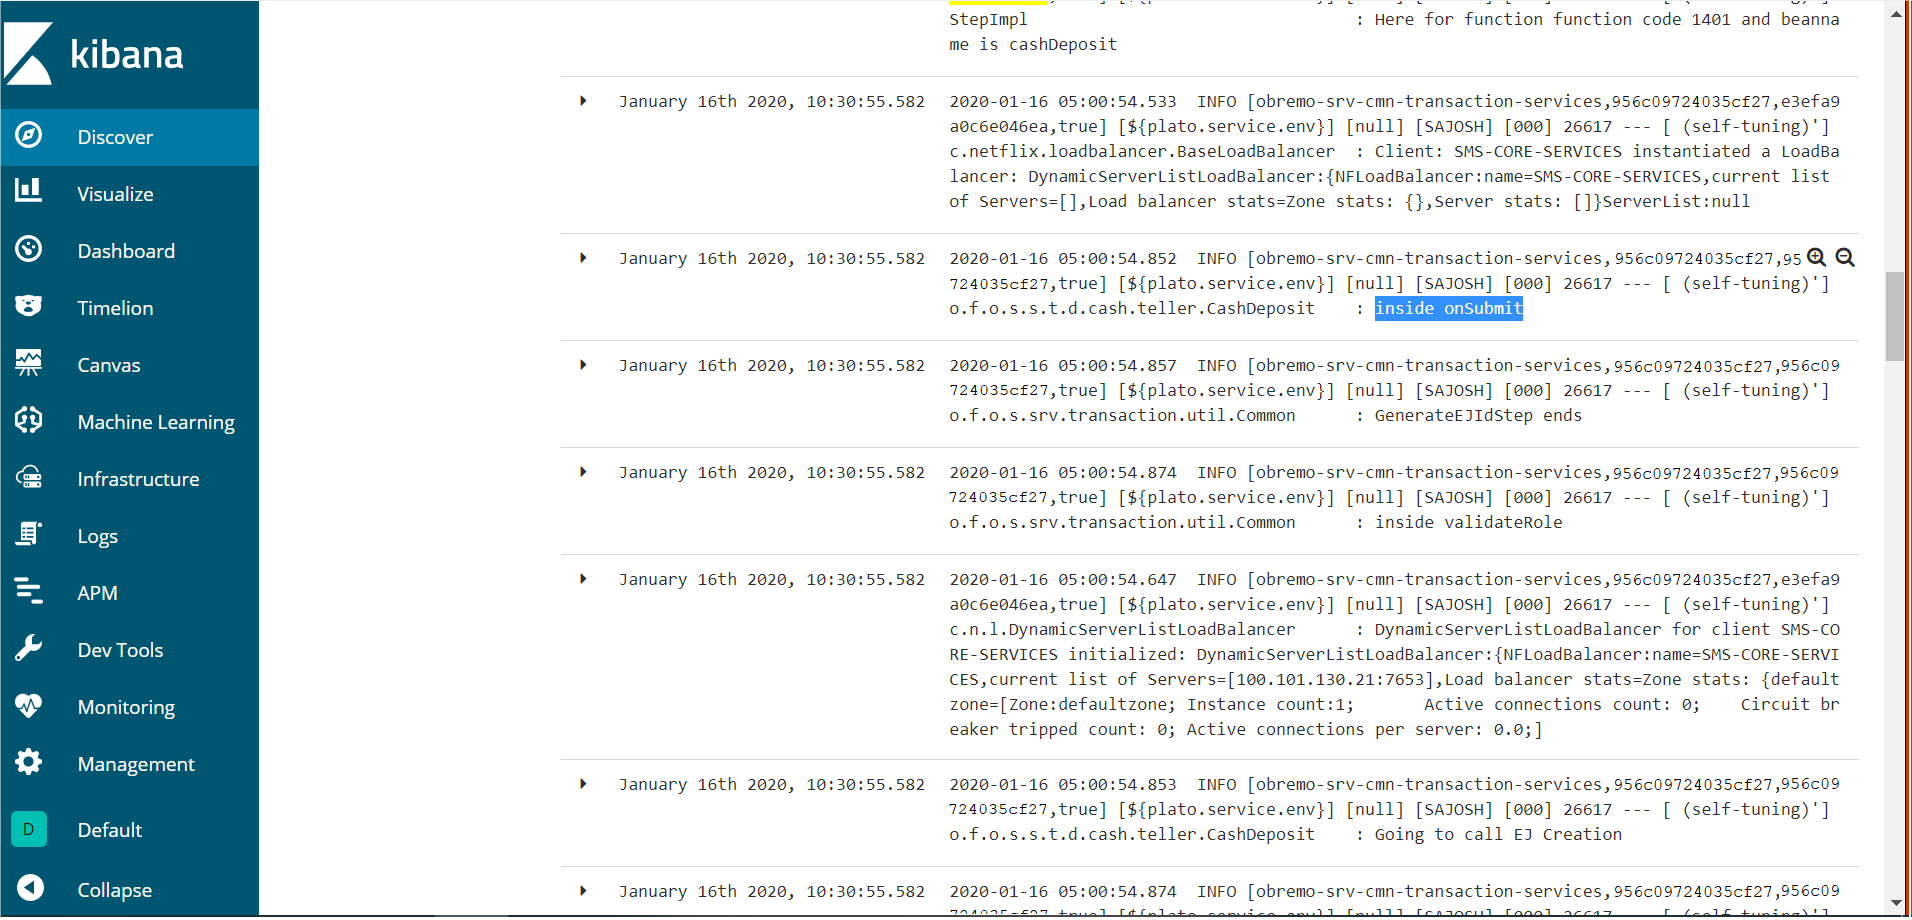
This topic describes the information to setup, search and export the logs in Kibana.
Setup Dynamic Log Levels in Oracle Banking Microservices Architecture Services without Restart
The plato-logging-service is dependent on two tables, which needs to be present in the PLATO schema (JNDI name: jdbc/PLATO). The two tables are as follows:
- PLATO_DEBUG_USERS: This table contains the information about whether the dynamic logging is enabled to a user for a service. The table will have records, where DEBUG_ENABLED values for a user and a service have values Y or N, and depending on that plato-logger will enable dynamic logging.
- PLATO_LOGGER_PARAM_CONFIG: This table contains the key-value entries of different parameters that can be changed at runtime for the dynamic logging.
The values that can be passed are as follows:
- LOG_PATH: This specifies a dynamic logging path for the logging files to be stored. Changing this in runtime, changes the location of the log files at runtime. If this value is not passed then by default, the LOG_PATH value is taken from the -D parameter of
plato.service.logging.path. - LOG_LEVEL: The level of the logging can be specified on runtime as INFO or ERROR etc. The default value of this can be set in the
logback.xml. - LOG_MSG_WITH_TIME: Making this Y appends the current date into the log file name. Setting the value of this as N cannot append the current date into the filename.
- LOG_PATH: This specifies a dynamic logging path for the logging files to be stored. Changing this in runtime, changes the location of the log files at runtime. If this value is not passed then by default, the LOG_PATH value is taken from the -D parameter of
Search for Logs in Kibana
Search logs in Kibana using https://www.elastic.co/guide/en/kibana/current/search.html.
Export Logs for Tickets
Perform the following steps to export logs:
- Click Share from the top menu bar.
- Select the CSV Reports option.
- Click Generate CSV button.


