1 Observability Improvements using Zipkin Traces

This topic describes the troubleshooting procedures using the Zipkin Traces.

1.1 Setting Zipkin Server

This topic provides the information to install and setup Zipkin server.

Refer to ANNEXURE - 2 for the installation and setup the Zipkin server.

1.2 Troubleshooting Zipkin

This topic provides the systematic instructions to troubleshooting using Zipkin Traces.

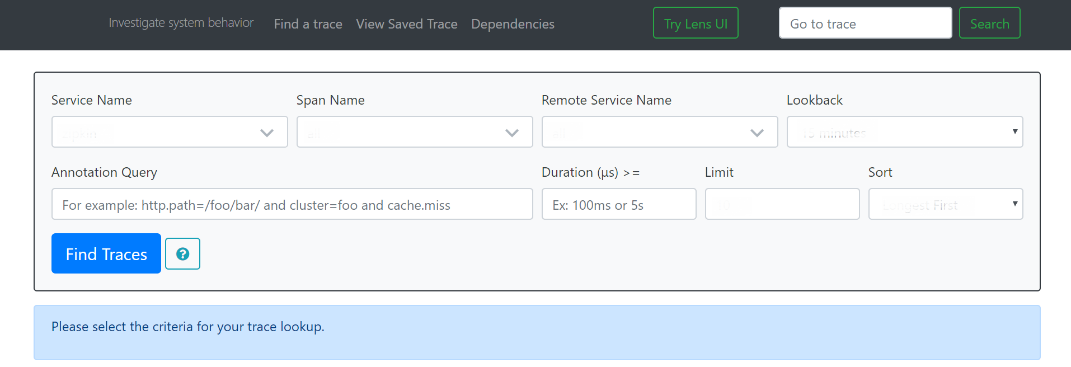
  1. Launch the Zipkin URL.
    The Layout of Zipkin screen displays.
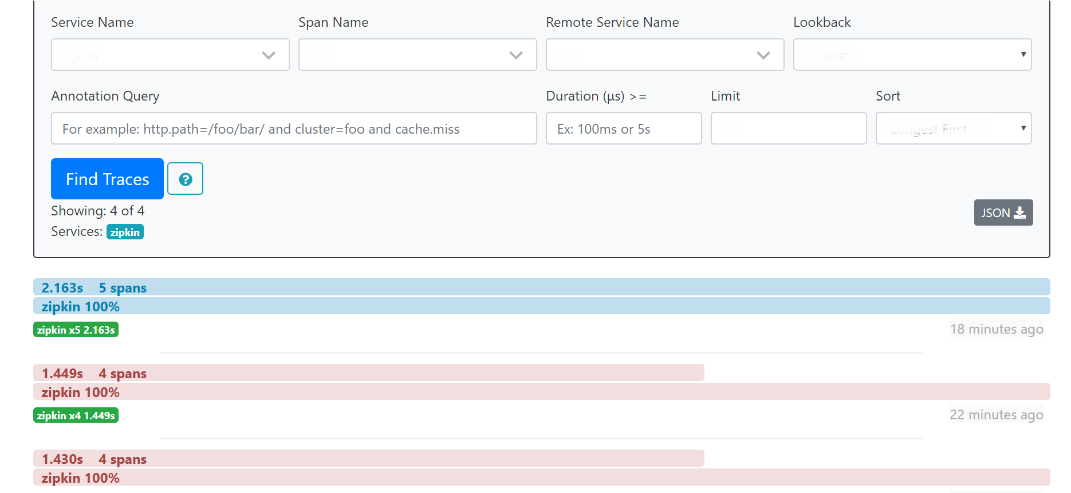
  2. Use Search to find the traces of required API calls and services.
    The List of Traces screen displays.

    Note:

    The search options given in the user interface are self-explanatory, and there is another UI option (Try Lens UI). It is given a different user interface with the same functionality. The list of the traces can be seen as shown in the above screen. Error API calls are made to showcase how to track errors. The blue listing shows the successful API hits, and the red listing indicates the errors. Each block indicates a single trace in the listing.
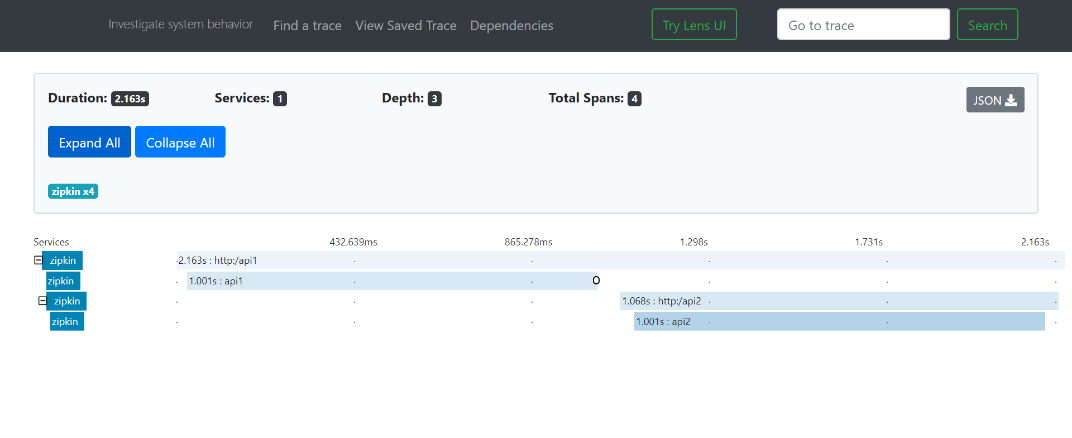
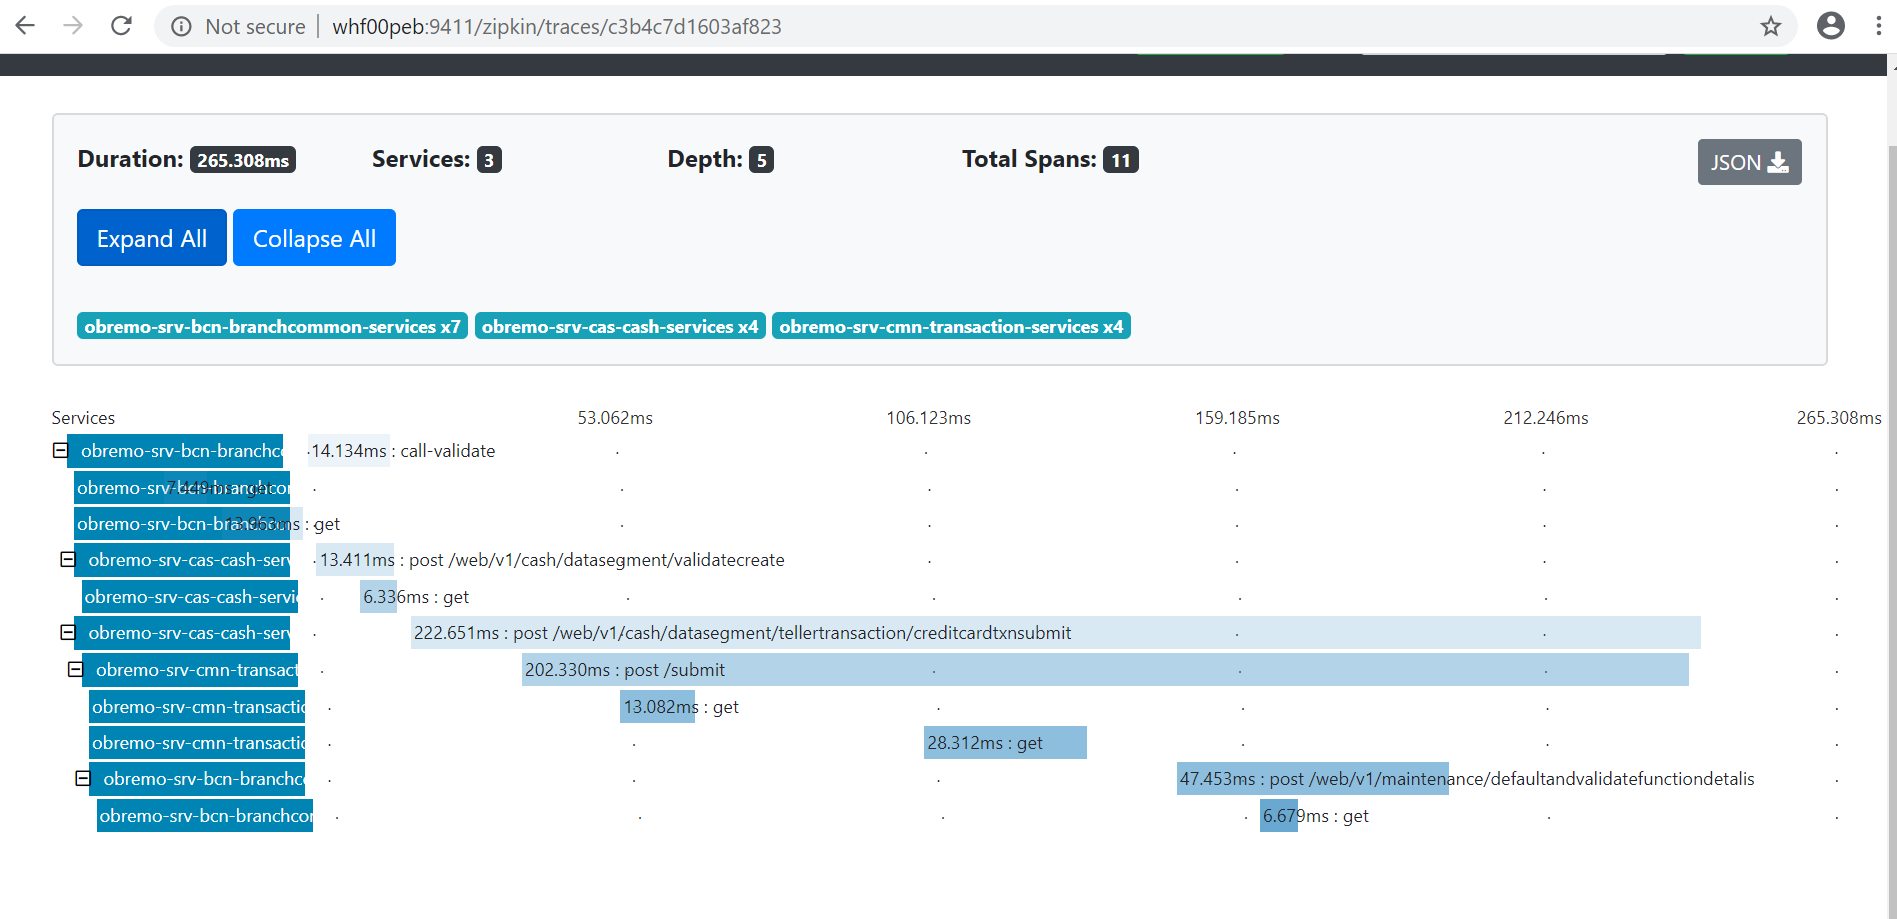
  3. Open an individual trace to view the details of the trace.
    The Individual Trace screen displays.

    Note:

    Individual Trace describes the time taken for each block. As the two custom spans are created inside two service calls, user can find a total of four blocks. The time taken for an individual block is shown in the above screen.
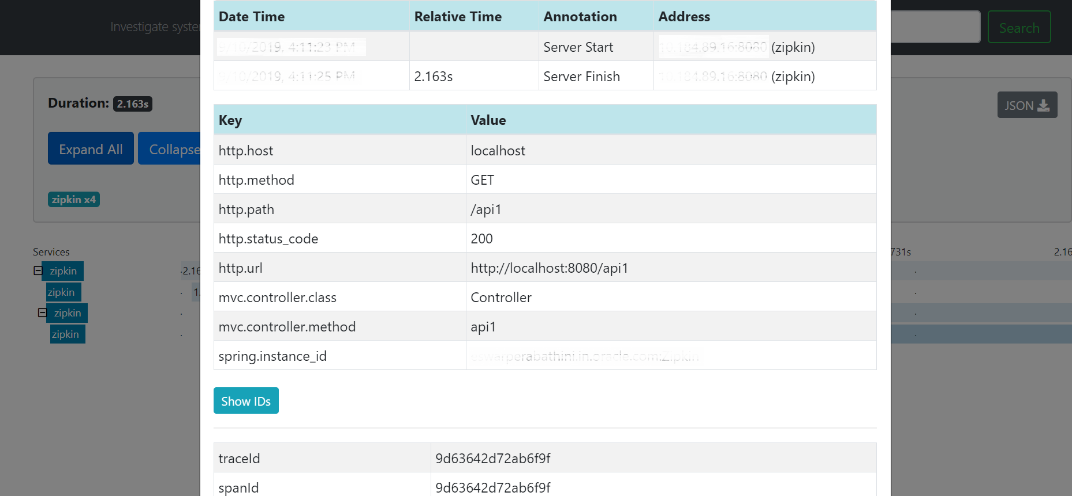
  4. Click an individual block to display the details.
    The Details of Individual Block screen displays.

    Figure 1-4 Details of Individual Block


    Note:

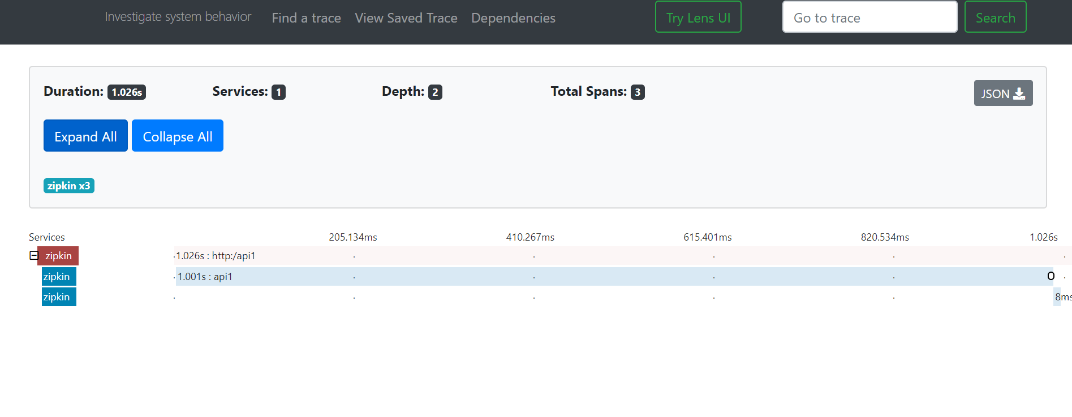
    The user can also view the span block details and logging events in the Zipkin UI as small circular blocks. An example of an error log is shown in the below screen.
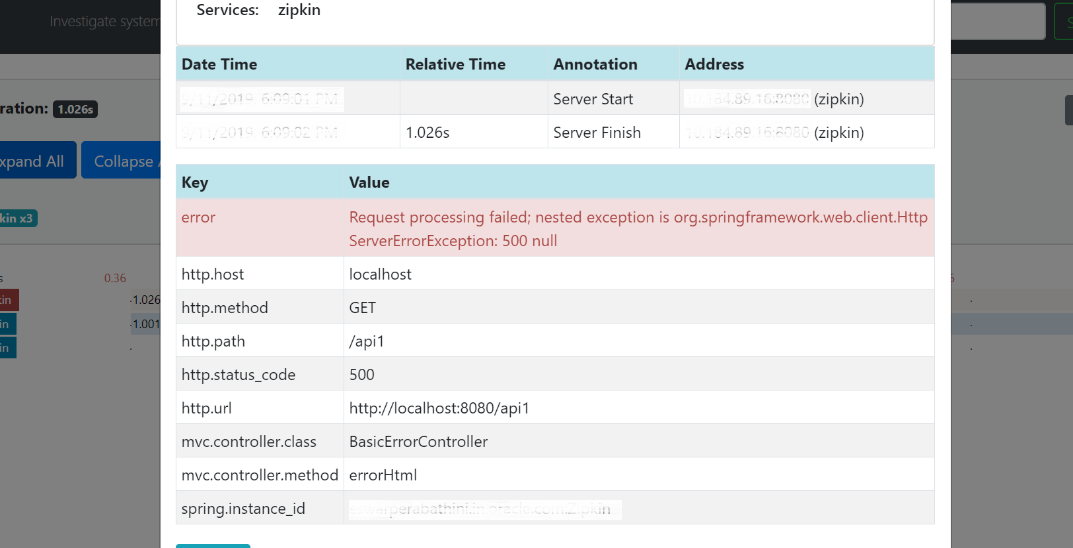
  5. Click the error portion to get clear details and place of the error.
    The Details of Error screen displays.

    Note:

    If the Lens UI is used in Zipkin, the above figures are not applicable but are relatable to the Lens UI as well. Traces of the application can be found using TraceId. The TraceId can be found in the debug logs of the deployment when spring-cloud-sleuth is included in the dependencies (included in spring-cloud-starter-Zipkin dependency).
  6. Click Dependencies to get the dependency graph information between micro-services.
    The Sample Dependency Graph displays.

    Figure 1-7 Sample Dependency Graph


1.3 Zipkin Issues

This topic describes the various issues faced in Zipkin.

1.3.1 Application Service is not Registered

This topic describes the systematic instructions to register the application service.

  1. Check the applications that are sending the trace report to the Zipkin server from Service Name drop-down list.
  2. If the required application is not listed in Zipkins, check the application.yml file for Zipkin base URL configuration.

    Figure 1-9 Application.yml File


    Note:

    The shipped application.yml should have the Zipkin entry. Every service should have a spring-cloud-sleuth-zipkin dependency added in the build gradle file for the service to generate and send trace Id and span Id.
  3. Specify the necessary values are as follows:
    Compile group: org.springframework.cloud

    Name: spring-cloud-sleuth-zipkin

    Version: 2.1.2.RELEASE

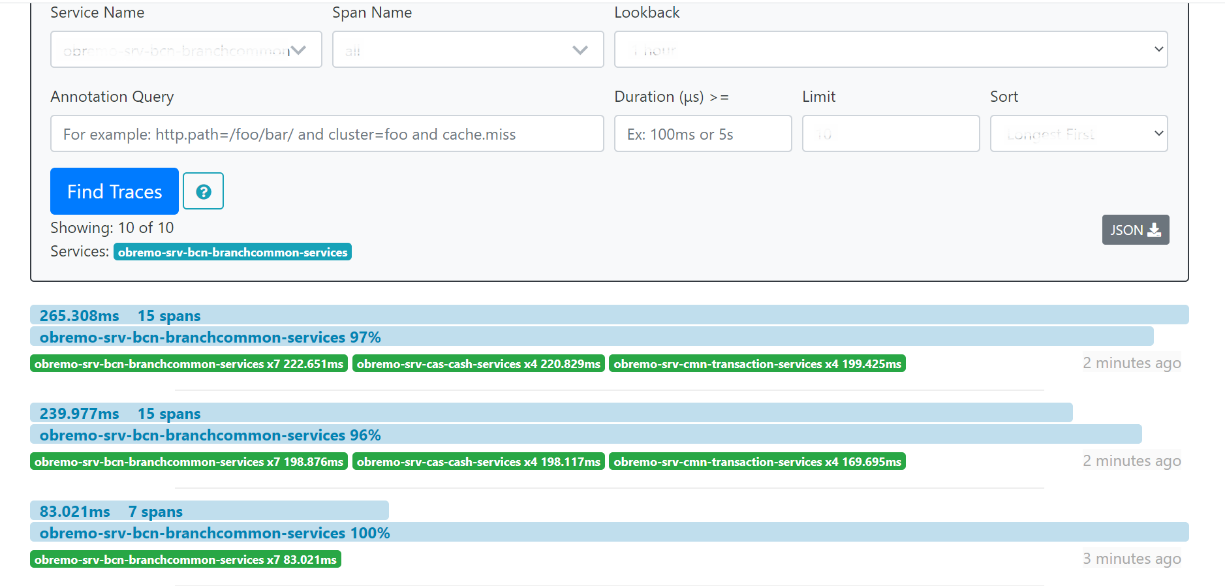
    Figure 1-10 Branch Common Services


    Figure 1-11 Branch Common Services Trace


1.3.2 404 Error

This topic provides the information to troubleshoot the 404 Error in the application.

If there is a 404 error, check if the zipkin-server.jar is running in the system where the application is deployed. To check this, execute the following command:

netstat -ltnup | grep ':9411'

The output should be like as below:

tcp6 0 0 :::9411 :::* LISTEN 10892/java

Here 10892 is the PID.
1.3.3 Unable to Change Zipkin Default Port Number

This topic provides the information to change the Zipkin Default Port Number in the application.

Zipkin default port number is not editable.

Hence, make sure that the port 9411 is available to start Zipkin-server.jar file.