1 Document Tracing Zipkin
This topic describes the procedure to install and run the document tracing zipkin.
- Zipkin Installation
This topic describes the systematic instructions to download and install the zipkin. - Troubleshoot Zipkin
This topic describes the systematic instructions to troubleshoot using Zipkin Traces.
1.1 Zipkin Installation
This topic describes the systematic instructions to download and install the zipkin.
- Download the Zipkin
This topic provides systematic instructions to download the Zipkin. - Configure the Zipkin
This topic provides systematic instructions to configure the Zipkin.
Parent topic: Document Tracing Zipkin
1.1.1 Download the Zipkin
This topic provides systematic instructions to download the Zipkin.
The Zipkin works as an independent application and can be downloaded as a runnable jar from the official website of Zipkin https://zipkin.io/. The latest version of Zipkin needs a Java version above 8.
Note:
For the exact version to be installed, refer to Software Prerequisites section in Release Notes.- Download the Zipkin from the direct link of jar is https://search.maven.org/remote_content?g=io.zipkin&a=zipkin-server&v=LATEST&c=exec.
- Execute the downloaded jar using the java
–jar JAR_NAMEcommand.
Parent topic: Zipkin Installation
1.1.2 Configure the Zipkin
This topic provides systematic instructions to configure the Zipkin.
The configuration of Zipkin can be done with environment variables.
Parent topic: Zipkin Installation
1.2 Troubleshoot Zipkin
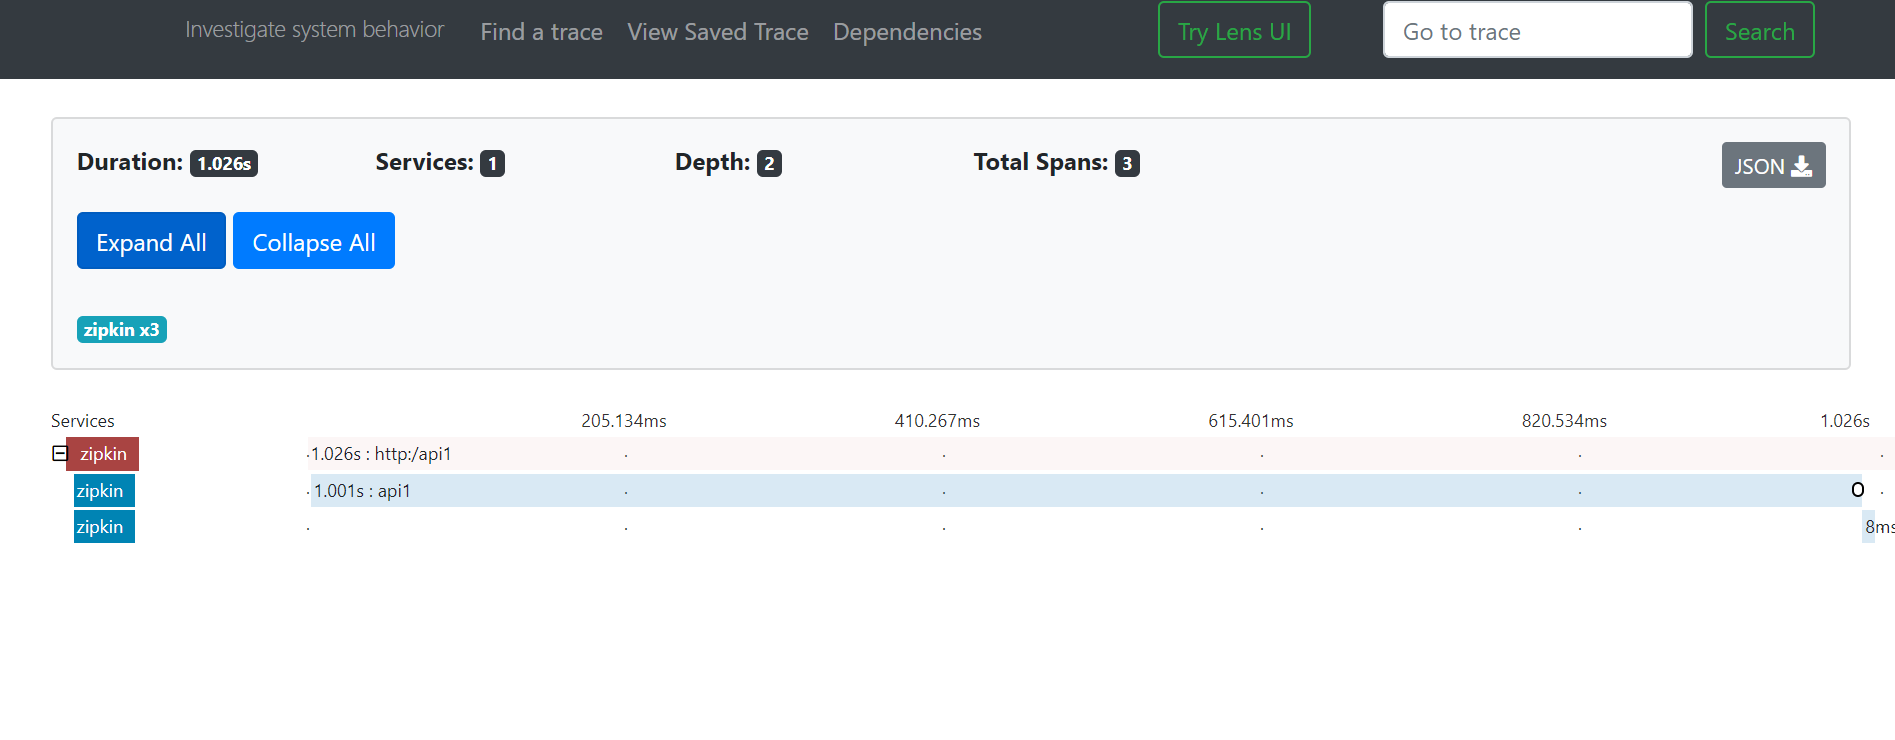
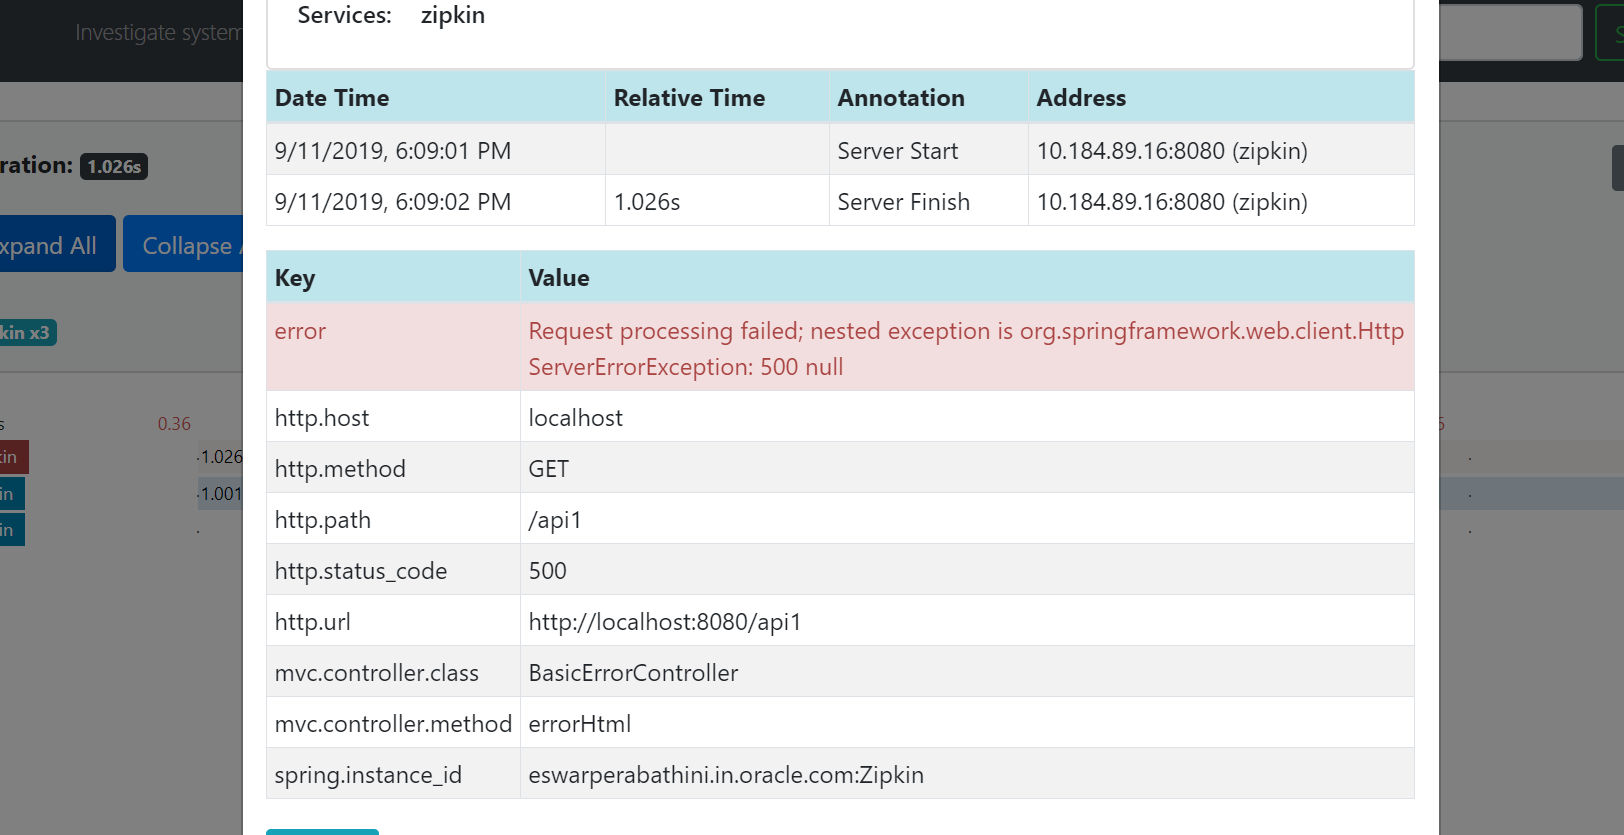
This topic describes the systematic instructions to troubleshoot using Zipkin Traces.
Parent topic: Document Tracing Zipkin
