2 Observability Improvements Logs using ELK Stack
This topic describes the troubleshooting procedures using the ELK Stack.
- Elasticsearch: It is an open-source, full-text search, and analysis engine based on the Apache Lucene search engine.
- Logstash: Logstash is a log aggregator that collects data from various input sources, executes different transitions and enhancements, and then transports the data to various supported output destinations.
- Kibana: Kibana is a visualization layer that works on top of Elasticsearch, providing users with the ability to analyze and visualize the data.
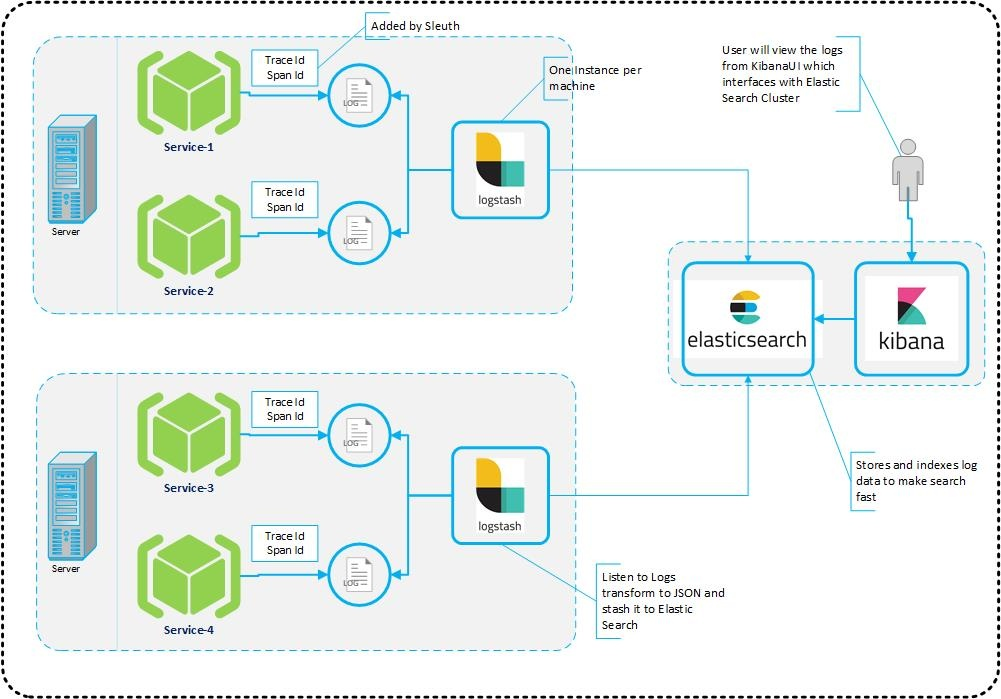
These components together are most commonly used for monitoring, troubleshooting, and securing IT environments. Logstash takes care of data collection and processing, Elasticsearch indexes and stores the data, and Kibana provides a user interface for querying the data and visualizing it.
- Introduction
- Architecture
This topic describes about architecture. - Setting up ELK Stack
This topic describes the systematic instruction to download, run and access the ELK Stack.
2.1 Introduction
- Elasticsearch
- Logstash
- Kibana
Elasticsearch is an open source, full-text search, and analysis engine, based on the Apache Lucene search engine. Logstash is a log aggregator that collects data from various input sources, executes different transformations and enhancements and then ships the data to various supported output destinations. Kibana is a visualization layer that works on top of Elasticsearch, providing users with the ability to analyze and visualize the data.
Together, these different components are most commonly used for monitoring, troubleshooting, and securing IT environments. Logstash takes care of data collection and processing, Elasticsearch indexes and stores the data, and Kibana provides a user interface for querying the data and visualizing it.
Parent topic: Observability Improvements Logs using ELK Stack
2.2 Architecture
This topic describes about architecture.
It provides a comprehensive solution for handling all the required facets.
Spring Cloud Sleuth also provides additional functionality to trace the application calls by providing us with a way to create intermediate logging events. Therefore, Spring Cloud Sleuth dependency must be added to the applications.
Parent topic: Observability Improvements Logs using ELK Stack
2.3 Setting up ELK Stack
This topic describes the systematic instruction to download, run and access the ELK Stack.
Download ELK Stack
- Run ELK Stack
This topic describes the systematic instruction to run the ELK Stack. - Access Kibana
This topic describes the information to access the kibana. - Kibana Logs
This topic describes the information to setup, search and export the logs in Kibana.
Parent topic: Observability Improvements Logs using ELK Stack
2.3.1 Run ELK Stack
This topic describes the systematic instruction to run the ELK Stack.
- Start Elastic Search
This topic provides systematic instructions to start Elastic Search. - Setup and Start Logstash
This topic provides the systematic instructions to setup and start Logstash. - Setup and Start Kibana
This topic provides the systematic instructions to setup and start Kibana.
Parent topic: Setting up ELK Stack
2.3.1.1 Start Elastic Search
This topic provides systematic instructions to start Elastic Search.
Parent topic: Run ELK Stack
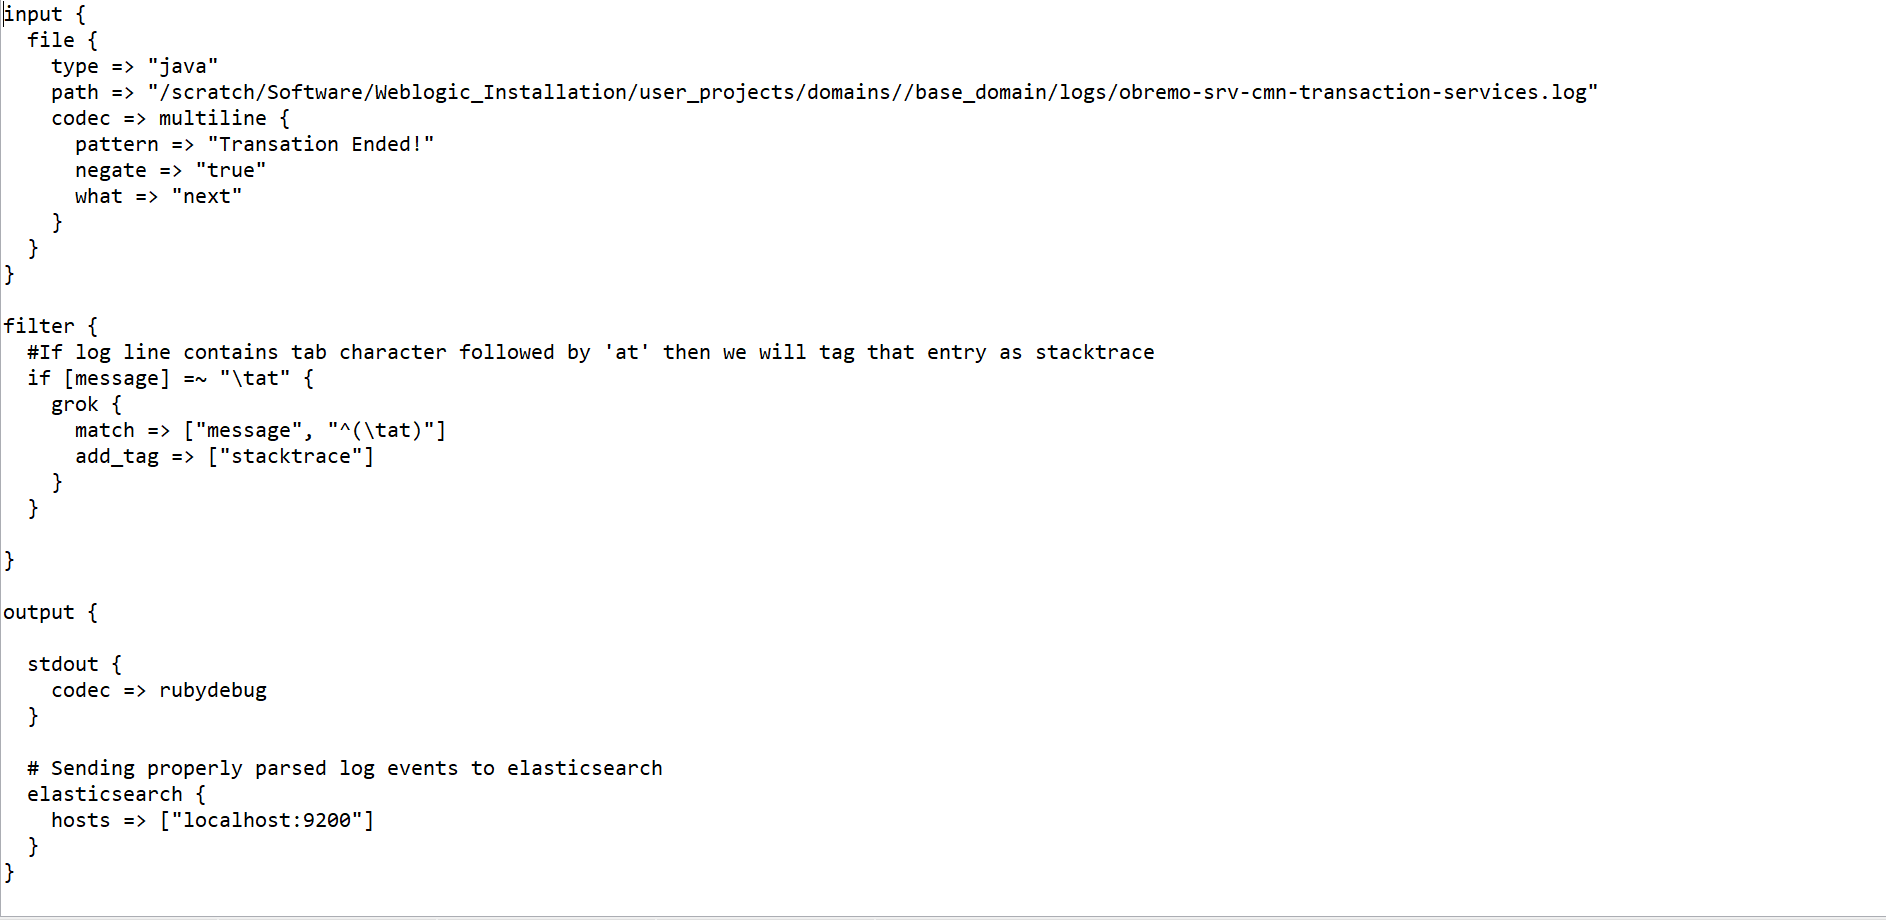
2.3.1.2 Setup and Start Logstash
This topic provides the systematic instructions to setup and start Logstash.
Parent topic: Run ELK Stack
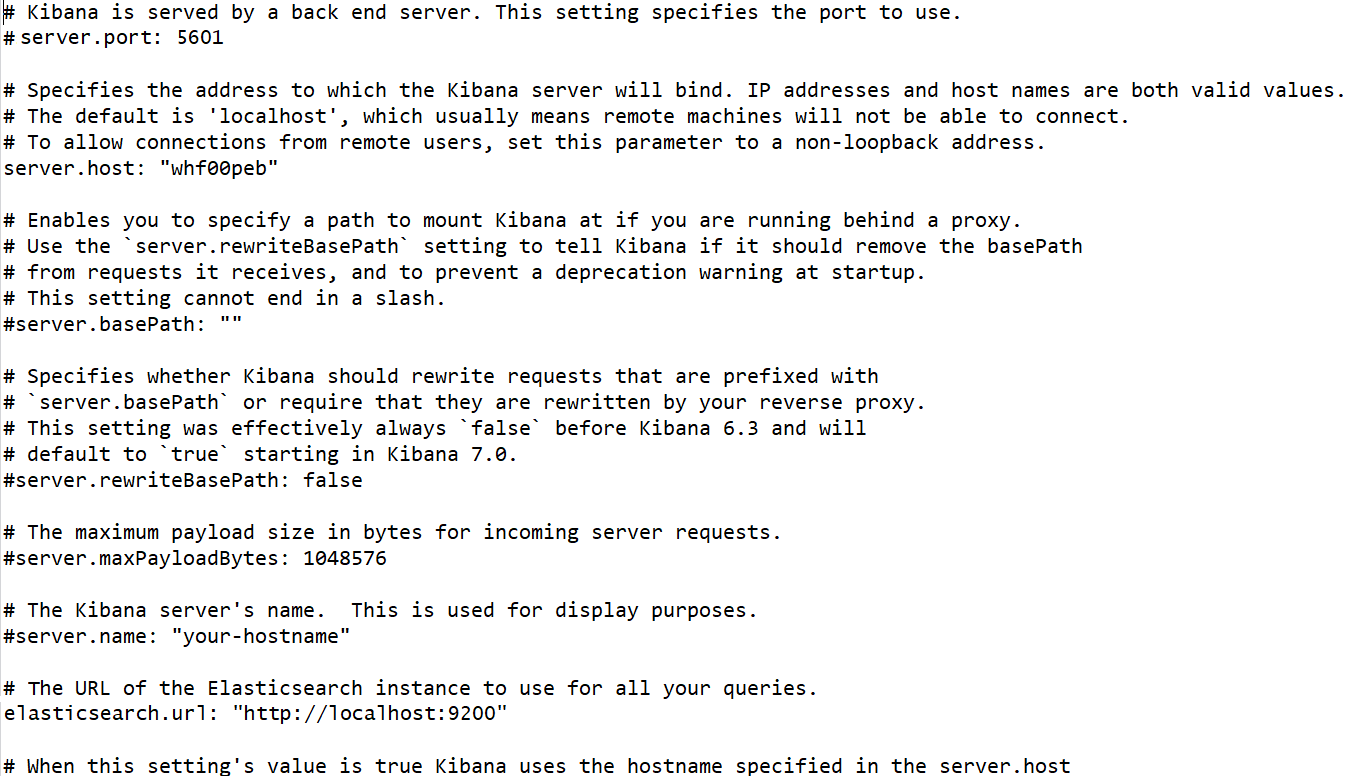
2.3.1.3 Setup and Start Kibana
This topic provides the systematic instructions to setup and start Kibana.
Parent topic: Run ELK Stack
2.3.2 Access Kibana
This topic describes the information to access the kibana.
Parent topic: Setting up ELK Stack
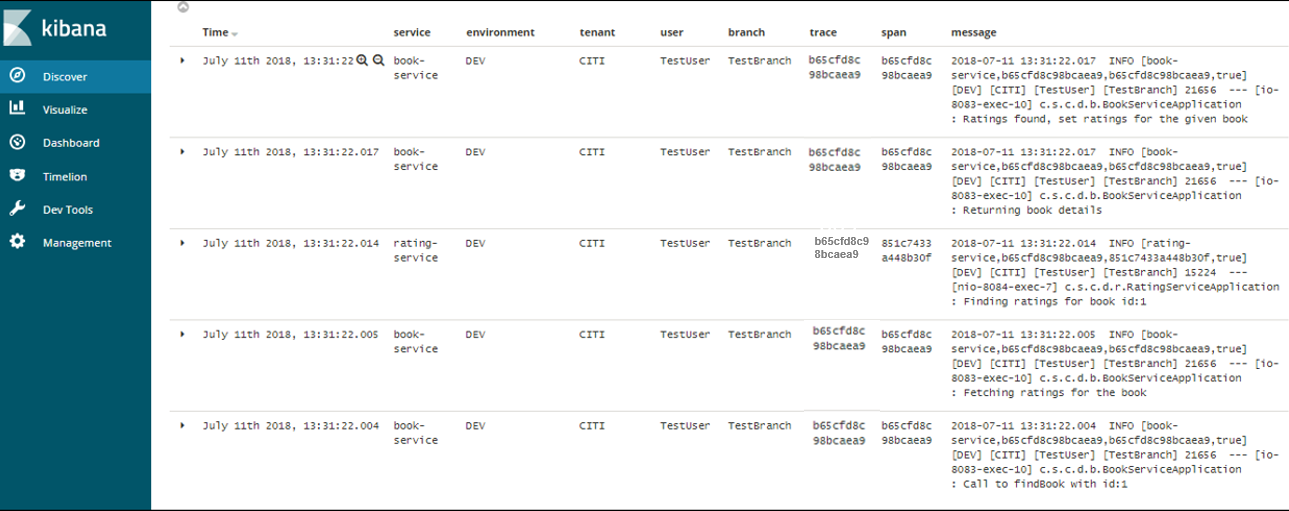
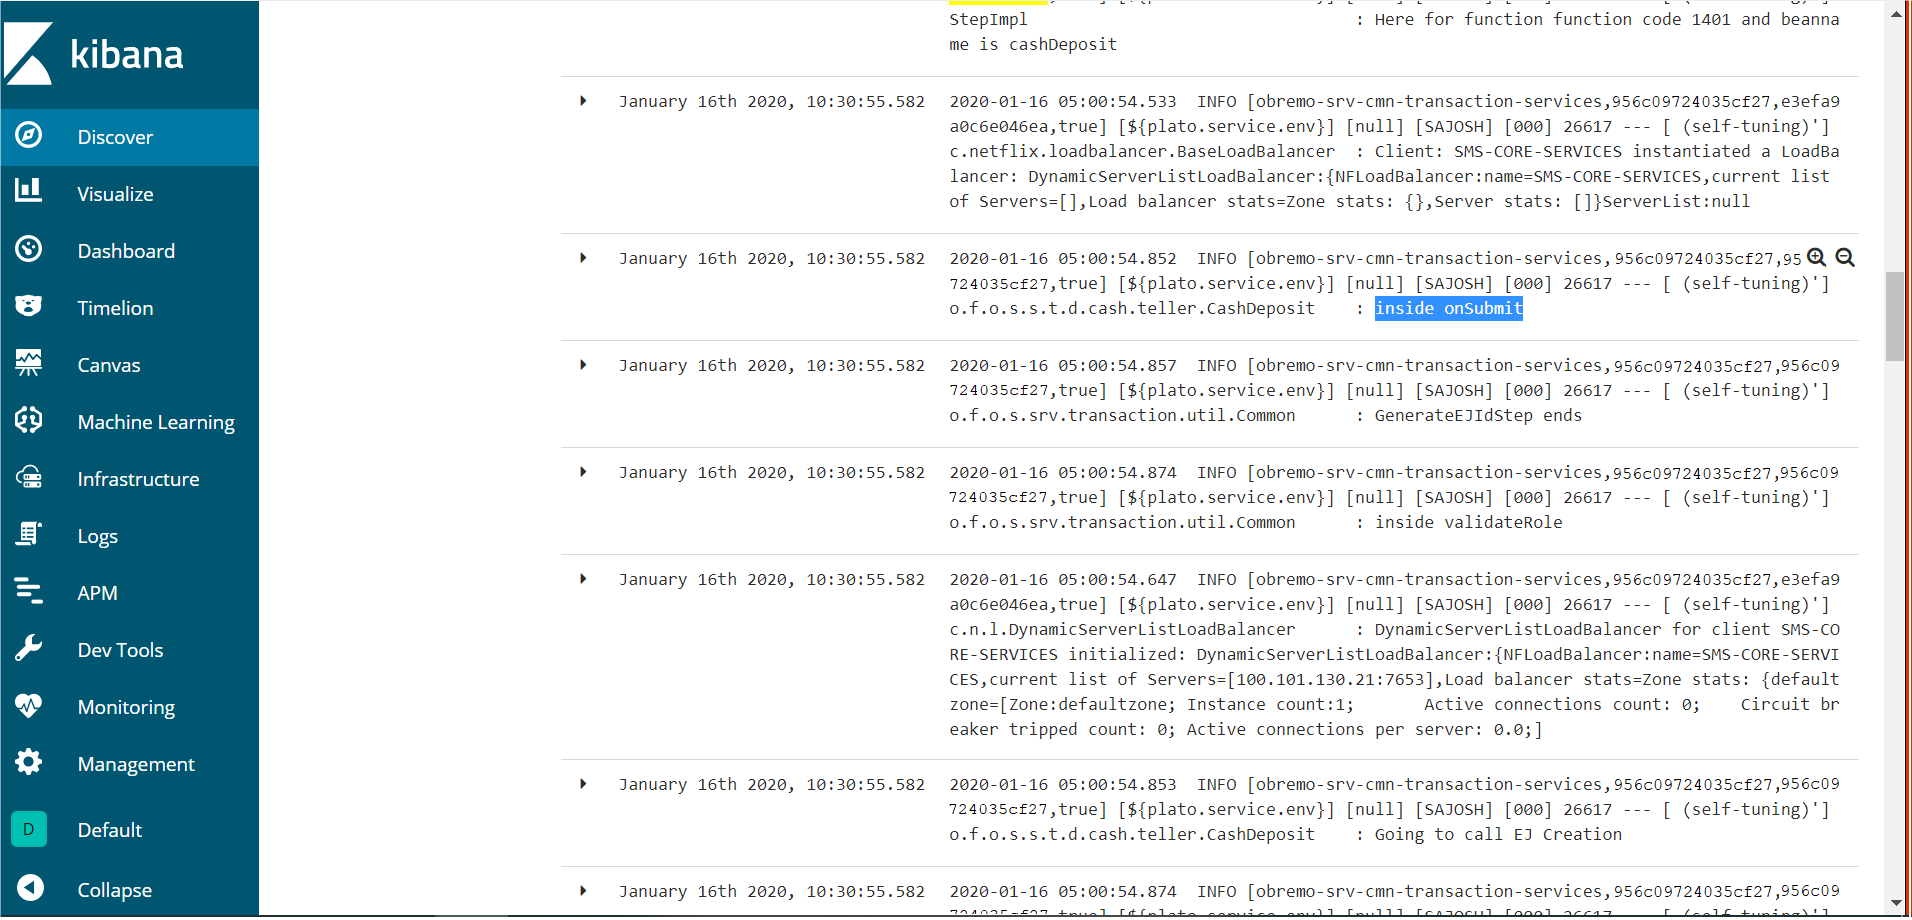
2.3.3 Kibana Logs
This topic describes the information to setup, search and export the logs in Kibana.
Setup Dynamic Log Levels in Oracle Banking Microservices Architecture Services without Restart
- PLATO_DEBUG_USERS: This table contains the information about whether the dynamic logging is enabled to a user for a service. The table will have records, where DEBUG_ENABLED values for a user and a service have values Y or N, and depending on that plato-logger will enable dynamic logging.
- PLATO_LOGGER_PARAM_CONFIG: This table contains the key-value entries of different parameters that can be changed at runtime for the dynamic logging.
The values that can be passed are as follows:
- LOG_PATH: This specifies a dynamic logging path for the logging files to be stored. Changing this in runtime, changes the location of the log files at runtime. If this value is not passed then by default, the LOG_PATH value is taken from the -D parameter of
plato.service.logging.path. - LOG_LEVEL: The level of the logging can be specified on runtime as INFO or ERROR etc. The default value of this can be set in the
logback.xml. - LOG_MSG_WITH_TIME: Making this Y appends the current date into the log file name. Setting the value of this as N cannot append the current date into the filename.
- LOG_PATH: This specifies a dynamic logging path for the logging files to be stored. Changing this in runtime, changes the location of the log files at runtime. If this value is not passed then by default, the LOG_PATH value is taken from the -D parameter of
Search for Logs in Kibana
Search logs in Kibana using https://www.elastic.co/guide/en/kibana/current/search.html.
Export Logs for Tickets
Perform the following steps to export logs:
- Click Share from the top menu bar.
- Select the CSV Reports option.
- Click Generate CSV button.
Parent topic: Setting up ELK Stack
