Use Case: Event-Based Framework Execution in Real-time Transaction Monitoring

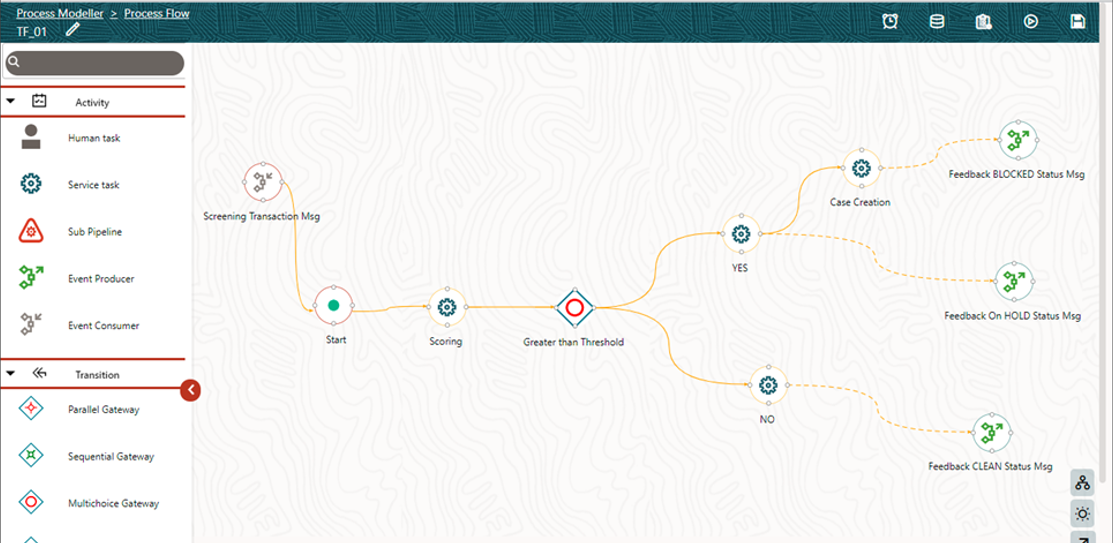
The operational mechanism of the Event Processing Pipeline is better understood with a Use Case that describes the execution of real-time Transaction Monitoring.
The following steps describe the Use Case Configuration:
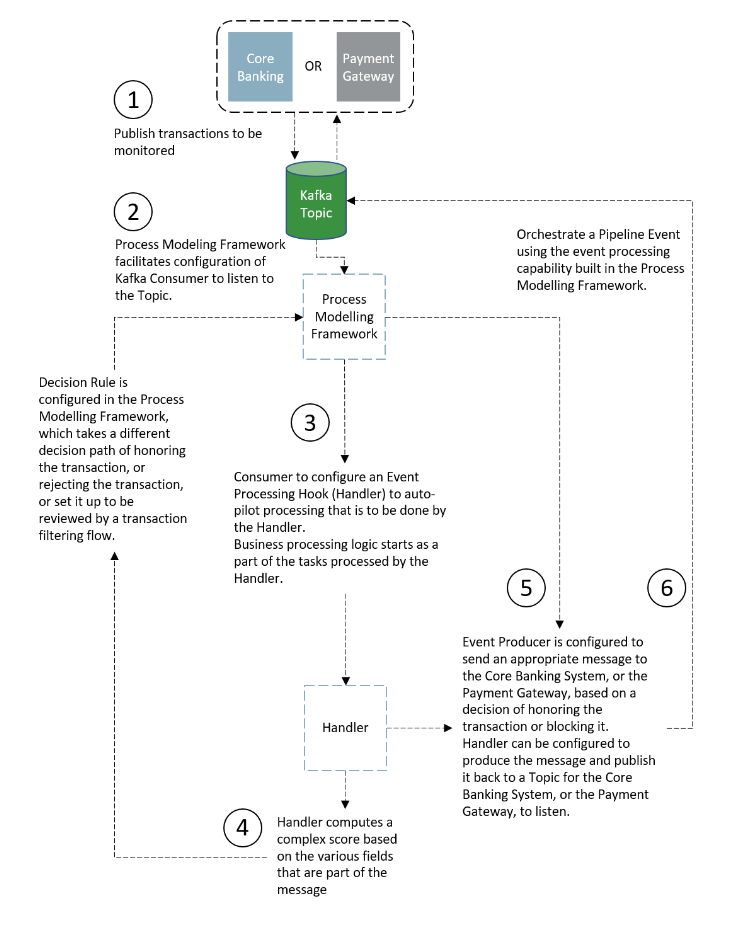
  1. The transactions that are to be monitored and honored are published by the Core Banking System, or the Payment Gateway, to a predefined Kafka Topic.
  2. The Process Modeling Framework facilitates the configuration of a Kafka Consumer which listens to the Topic.
  3. The Consumer allows configuring an Event Processing Hook (Handler) which auto-pilots any further processing that is to be done by the Handler. The Business Processing Logic starts as a part of the tasks processed by the Handler.
  4. The Handler computes a complex score based on the various fields that are part of the message. For example, the transaction amount added to the transaction withdrawal profile set for the customer for a specific look-back period exceeds a threshold and so cannot be honored.
  5. A Decision Rule is configured in the Process Modelling Framework, which takes a different decision path of honoring the transaction, or rejecting the transaction, or set it up to be reviewed by a transaction filtering flow.
  6. The Event Producer, which shows up further in the flow, is configured to send an appropriate message to the Core Banking System, or the Payment Gateway, based on a decision of honoring the transaction or blocking it. The Handler can be configured to produce the message and publish it back to a Topic for the Core Banking System, or Payment Gateway, to listen.
  7. A loosely coupled Pipeline Event can be orchestrated using the event processing capability built in the Process Modelling Framework.

    Figure 16-11 Use Case Flow Chart for Transaction Monitoring


    This image displays the Use Case Flow Chart for Transaction Monitoring.

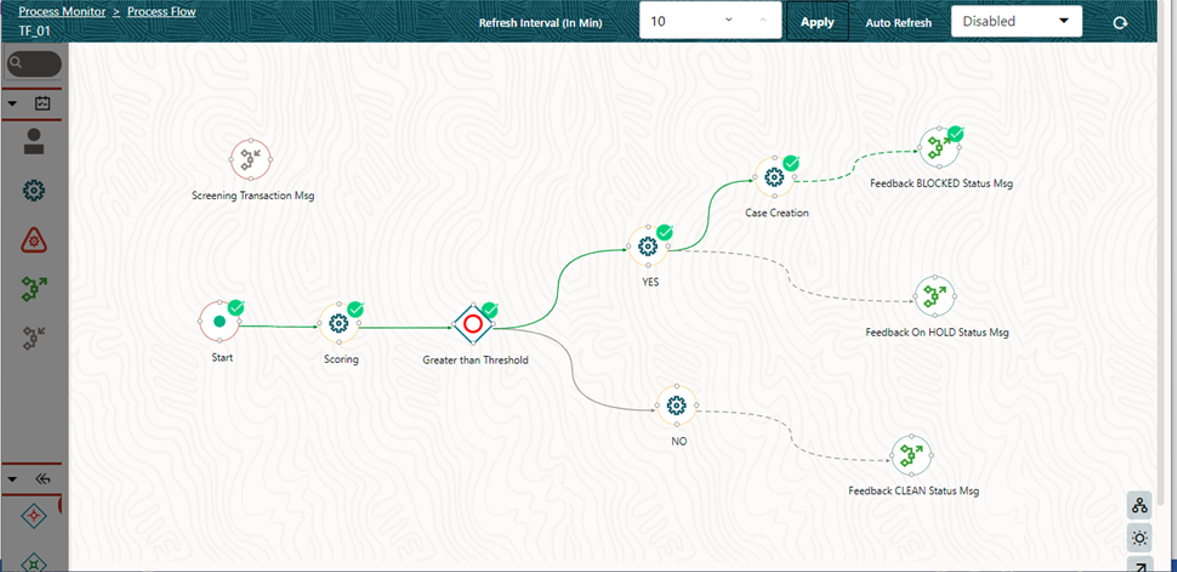
    The following illustrations of the Process Monitoring Window provide a visual view of the execution path the message has traveled:

    Figure 16-12 Process Monitoring Window Showing Execution Path


    This image displays the Process Monitoring Window Showing Execution Path.

    The execution path of the transactions and the various data fields that determined the execution path can be monitored using the monitoring capability within PMF. The information shows the lineage of the data flow which has resulted in the transaction being honored or blocked or put on hold.

    Figure 16-13 Process Monitoring Window Showing Lineage of Data Flow


    This image displays the Process Monitoring Window Showing Lineage of Data Flow.