6.1.5.5 Process Stats
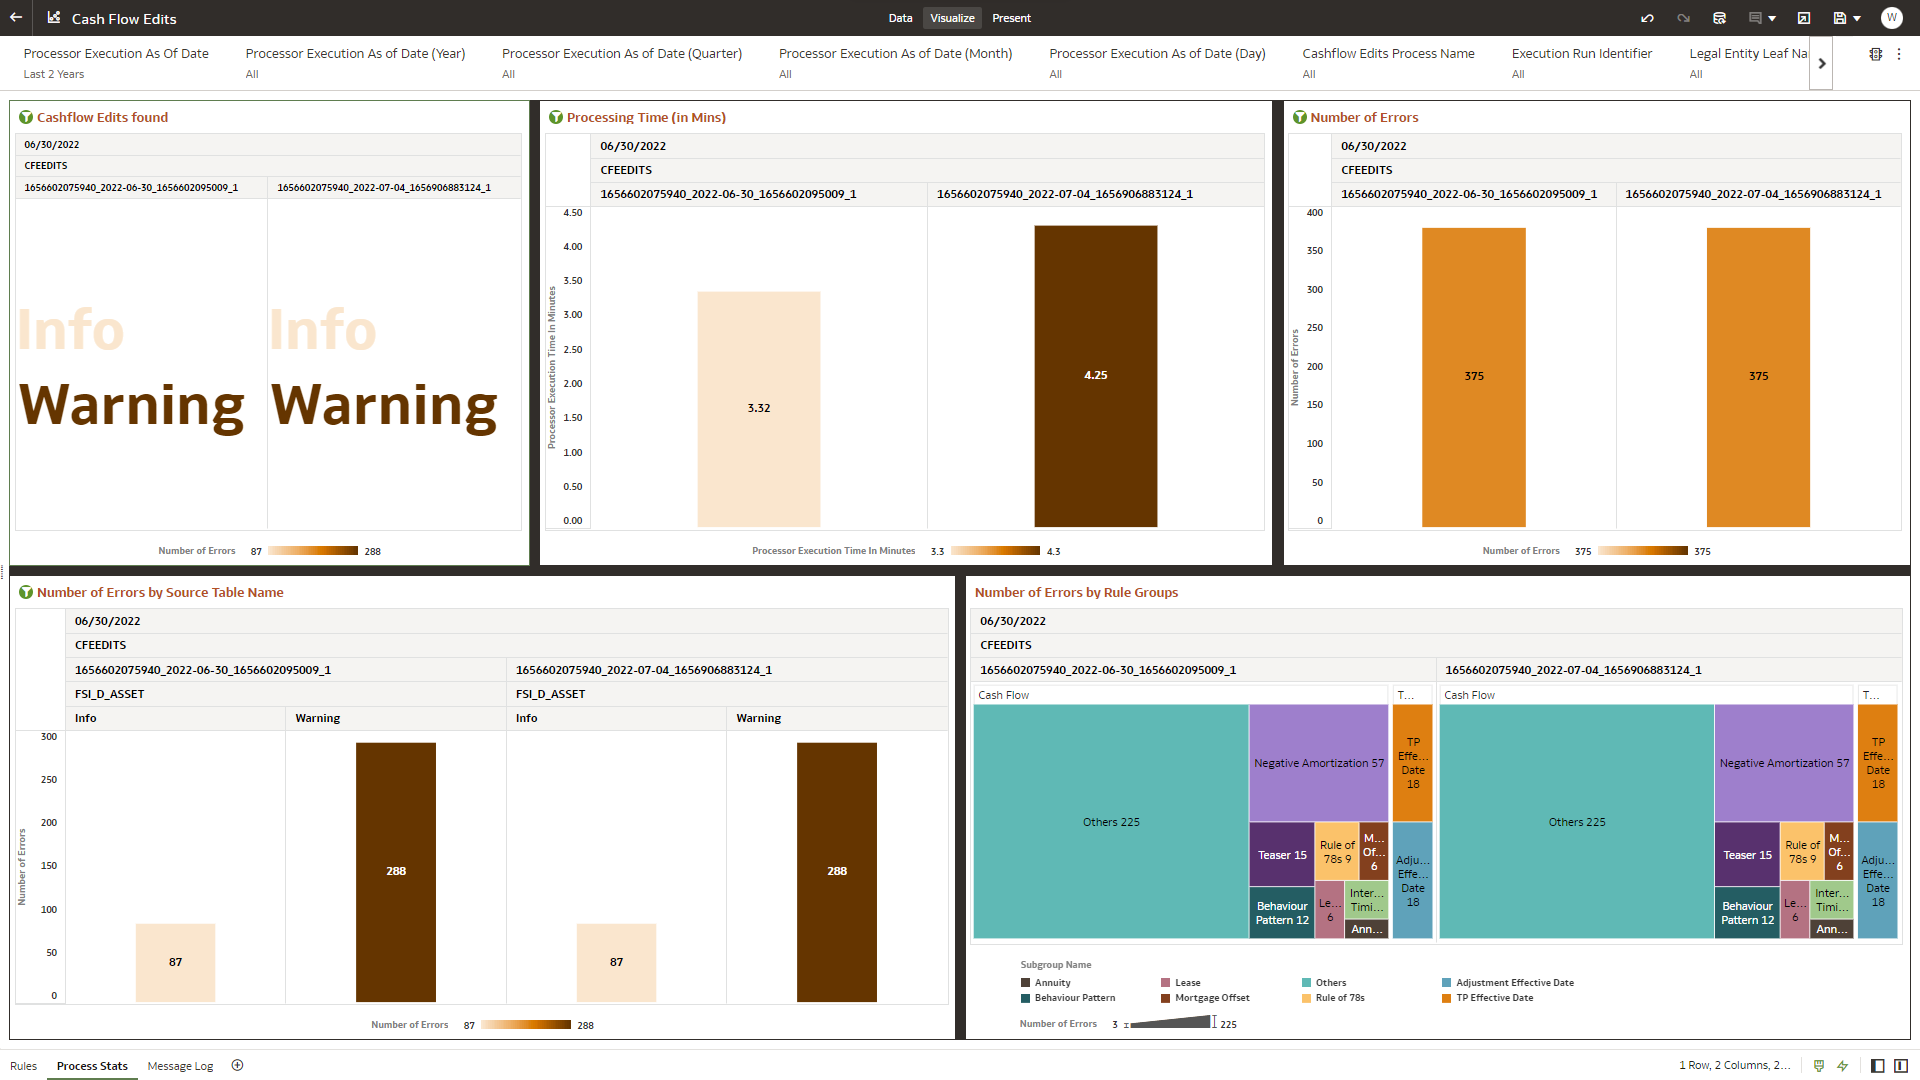
The “Process Stats” Report provides a view of the available statistics related to the execution of the Cash Flow Edits processes. You can use the report to identify the number of errors and the aggregated details for the Cash Flow Edits executed out of the underlying Instrument table account data.
You can use a series of Report Prompts, as previously described, to filter the data according to key attributes pertaining to the underlying Cash Flow Edit messages.
The report displays the underlying data according to the following Chart’ logic:
- Cashflow Edits found
The chart reports the trend analysis of the Number of Errors for each Cash Flow Edit execution with respect to Processor Execution As of Date and the Message Type received during the executions.
The columns displayed in the chart are the following:
- Processor Execution As of Date (Day)
- Cashflow Edits Process Name
- Execution Run Identifier
- Message Type Description
- Number of Errors
- Processing Time (in Mins)
The chart reports the trend analysis of the Processing Time for each Cash Flow Edit execution with respect to Processor Execution As of Date.
The columns displayed in the chart are the following:
- Processor Execution As of Date (Day)
- Cashflow Edits Process Name
- Execution Run Identifier
- Processor Execution Time In Minutes
- Number of Errors
The chart reports the trend analysis of the Number of Errors for each Cash Flow Edit execution with respect to Processor Execution As of Date.
The columns displayed in the chart are the following:
- Processor Execution As of Date (Day)
- Cashflow Edits Process Name
- Execution Run Identifier
- Number of Errors
- Number of Errors by Source Table Name
The chart reports the trend analysis of the Number of Errors for each Cash Flow Edit execution with respect to Processor Execution As of Date and the Source Table Name where the errors have been identified.
The columns displayed in the chart are the following:
- Processor Execution As of Date (Day)
- Cashflow Edits Process Name
- Execution Run Identifier
- Source Table Name
- Message Type Description
- Number of Errors
- Number of Errors by Rule Groups
The chart reports the trend analysis of the Number of Errors for each Cash Flow Edit execution with respect to Processor Execution As of Date and the Rule Group/Subgroup.
The columns displayed in the chart are the following:
- Processor Execution As of Date (Day)
- Cashflow Edits Process Name
- Execution Run Identifier
- Group Name
- Subgroup Name
- Number of Errors
Figure 6-106 “Process Stats” Report
