4.1 General Remarks BSP BI Report Navigation and Content Details
The following reports are enabling drill-down and roll-up analysis for all Hierarchical Levels as explained in the previous chapter Use Report Hierarchical Levels.
Table 4-1 List OOTB Reports
| SL.No | OOB Reports |
|---|---|
| 1 | Balances |
| 2 | Runoff Details |
| 3 | Net Interest Margin |
| 4 | Ending Rates |
| 5 | Average Rates |
| 6 | Funding Center IS |
| 7 | Forecast Set Details |
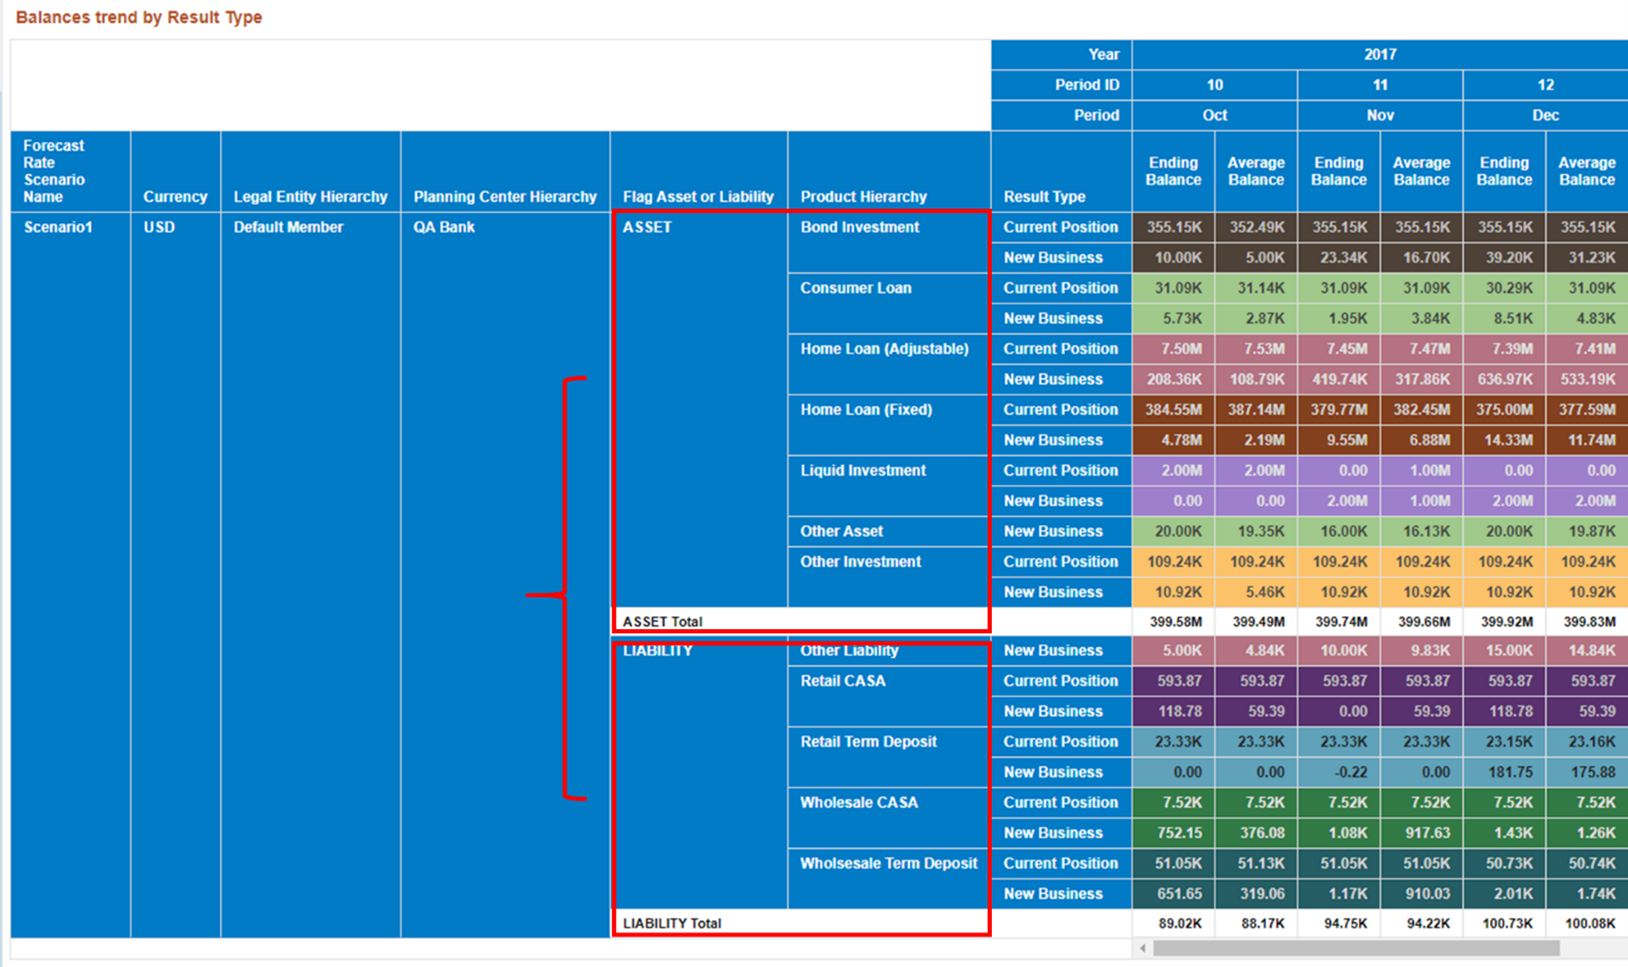
For every report canvas, when doing roll-up and drill-down navigation of the results, the metrics are always displayed by “Asset” and “Liability”.
The following are the screenshots to demonstrate the same.


Figure 4-1 Metrics in terms of Asset and Liability

Figure 4-2 Metrics in terms of Asset and Liability
