C.4 About Threshold Analyzer Role to Threshold Analyser Utility User Interface Mapping
In the Threshold Analyzer user interface (UI), you can view elements on a particular page that correspond to threshold analyzer role and threshold analysis elements of interest.
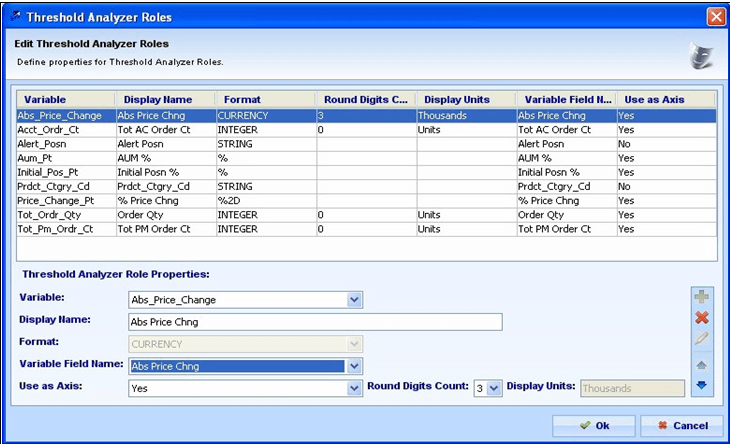
In the Threshold Analyzer Roles dialog box, you can view related threshold attributes, as in the sample entries in the following figure.
Figure C-7 Threshold Analyzer Role Dialog Box

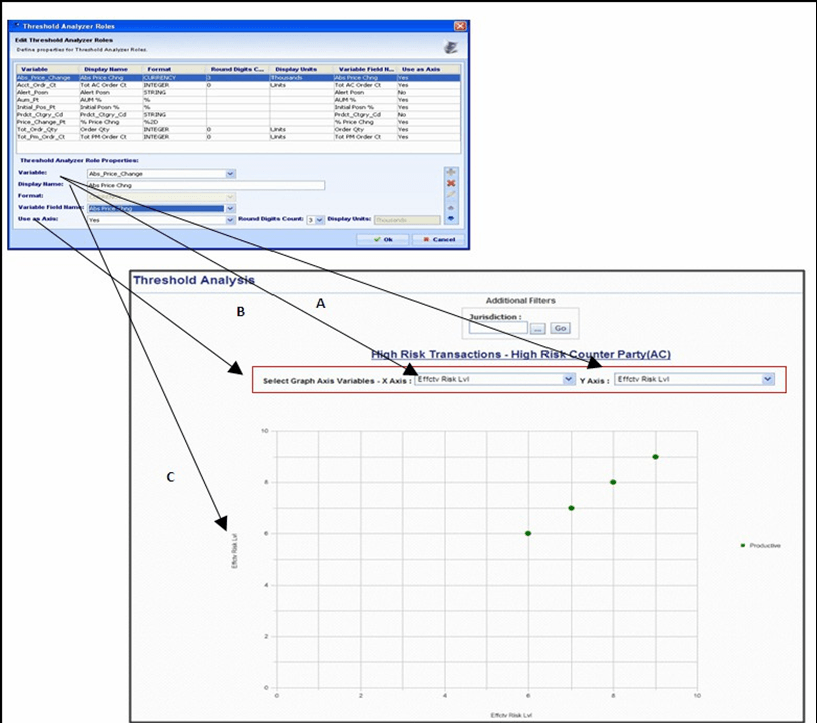
Correspondence of these elements within the threshold analyzer role and threshold analysis in the Threshold Analyzer utility the following figure.
Figure C-8 UI Mapping Sample - Threshold Analyzer Roles to Threshold Analysis

In the figure, the UI’s Threshold Analysis section contains threshold elements from the Threshold Analyzer Roles dialog box:
- In the Threshold Analyzer Roles dialog box, the Variable name maps to the UI’s Variables drop- down (A).
- In the Threshold Analyzer Roles dialog box, the Use as Axis field maps to the display of the X/Y axis variables drop-down list (B).
- In the Threshold Analyzer Roles dialog box, the Display Name field maps to the display name of X and Y axis of the graph (C).