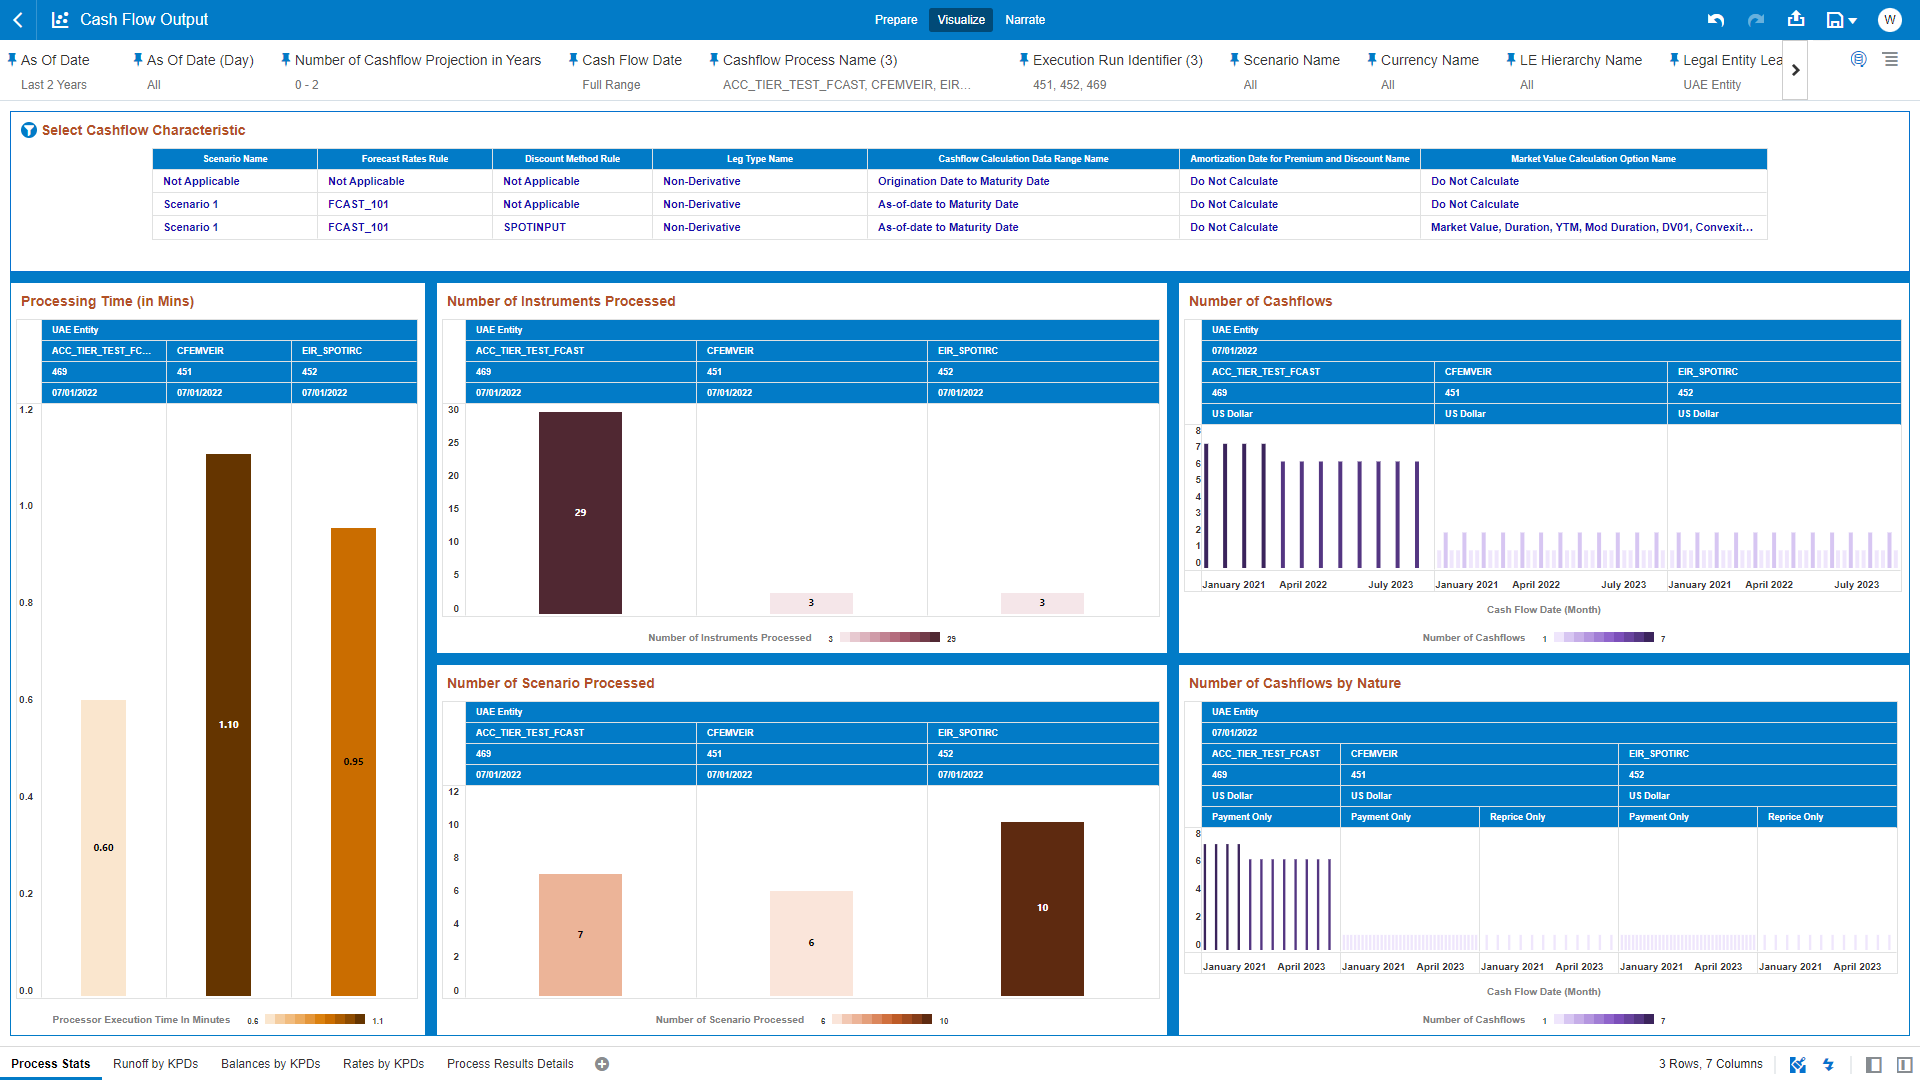
8.1.5 Process Stats
The “Process Stats” Report provides a view of the available statistics related to the execution of the Cash Flow Output processes. You can use the report to identify the process statistics related to the processing time, the number of cashflow generated as well as the number of instruments and scenarios processed.
You can use a series of Report Prompts, as previously described, to filter the data according to key attributes pertaining to the underlying Cash Flow Output results.
The report displays the underlying data according to the following Chart’ logic:
-
Select Cashflow CharacteristicThe chart provides you with a selection capability on the desired Cashflow characteristics utilized by the Cashflow Output processes.
The columns displayed in the chart are the following:
- Scenario Name
- Forecast Rates Rule
- Discount Method Rule
- Leg Type Name
- Cashflow Calculation Data Range Name
- Amortization Date for Premium and Discount Name
- Market Value Calculation Option Name
-
Processing Time (in Mins)The chart reports the trend analysis of the Processing Time for each Cash Flow Output execution with respect to As of Date.
The columns displayed in the chart are the following:
- Legal Entity Leaf Name
- Cashflow Process Name
- Execution Run Identifier
- As Of Date (Day)
- Processor Execution Time In Minutes
-
Number of Instruments ProcessedThe chart reports the trend analysis of the Number of Instruments Processed for each Cash Flow Output execution with respect to As of Date.
The columns displayed in the chart are the following:
- Legal Entity Leaf Name
- Cashflow Process Name
- Execution Run Identifier
- As Of Date (Day)
- Number of Instruments Processed
-
Number of Cashflows
The chart reports the trend analysis of the Number of Cashflows generated for each Cash Flow Output execution with respect to As of Date and Cash Flow Date (Month).
The columns displayed in the chart are the following:
- Legal Entity Leaf Name
- As Of Date (Day)
- Cashflow Process Name
- Execution Run Identifier
- Currency Name
- Cash Flow Date (Month)
- Number of Cashflows
-
Number of Scenario Processed
The chart reports the trend analysis of the Number of Scenario processed for each Cash Flow Output execution with respect to As of Date.
The columns displayed in the chart are the following:
- Legal Entity Leaf Name
- Cashflow Process Name
- Execution Run Identifier
- As Of Date (Day)
- Number of Scenario Processed
-
Number of Cashflows by Nature
The chart reports the trend analysis of the Number of Cashflows generated for each Cash Flow Output execution with respect to As of Date, Cash Flow Date (Month) and Cash Flow Nature (“Cashflow Code Name”).
The columns displayed in the chart are the following:
- Legal Entity Leaf Name
- As Of Date (Day)
- Cashflow Process Name
- Execution Run Identifier
- Currency Name
- Cashflow Code Name
- Cash Flow Date (Month)
- Number of Cashflows
Figure 8-16 “Process Stats” Report
