4.2 Data Quality Registry
The Data Quality (DQ) Registry provides a detailed overview of the data quality checks available across different entities. It serves as a central repository to analyze and monitor the distribution and classification of these checks. Key highlights of this report include:
- Distribution of Checks: Offers a breakdown by type, severity, and class, providing insights into how checks are applied and their criticality across entities.
- Checks by Severity and Entity Types: Classifies checks based on their severity levels and applicable entity types, helping users pinpoint areas that need the most attention.
- Number of Checks by Entity: Showcases the prominence of data quality checks across different source tables. Larger font sizes indicate higher number of DQ Checks configured for that particular entity, providing a visually intuitive way to comprehend the distribution of DQ Checks.
- Activity - Results Data Browsing
- Objective: To highlight the number of data quality checks configured for different entities.
- Persona: Business Analyst
Table 4-4 Number of Checks by Entity
| Step Description | Observations |
|---|---|
| Follow the navigation path: Home → Catalog → Shared Folders → Data Quality Visualization à Data Quality à Data Quality Registry | Larger font sizes indicate higher number of Data Quality
checks. |
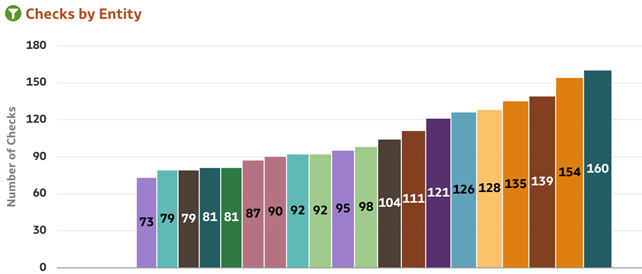
- Number of Data Quality Checks by Source Table (Bar Chart): This bar chart displays the source tables on the x-axis, arranged in ascending order based on the number of configured Data Quality (DQ) checks, which are shown on the y-axis.
- Activity - Results Data Browsing
- Objective: to provide a clear overview of the distribution of Data Quality (DQ) checks across source tables.
- Persona: Business Analyst
Table 4-5 Checks by Entity
| Step Description | Observations |
|---|---|
| Follow the navigation path: Home → Catalog → Shared Folders → Data Quality Visualization à Data Quality à Data Quality Registry Tab |
The chart displayed is based on the default filter criteria. This can be customized by choosing a different filter.
|
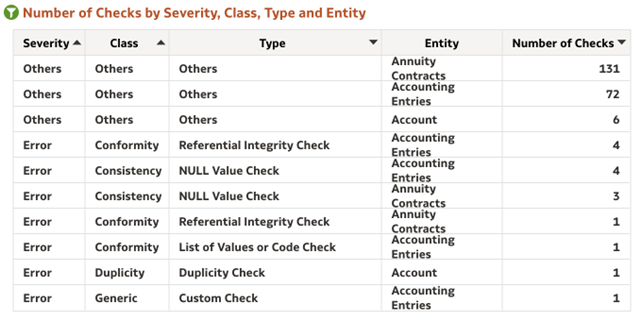
- Number of Checks by Severity, Class, Type and Entity (Table): Number of DQ checks are organized by Severity, Class and Type names for each entity, presented in a table format.
- Activity - Results Data Browsing
- Objective: To list all the DQ checks in a tabular format.
- Persona: Business Analyst
Table 4-6 Number of Checks by Severity, Class, Type, and Entity
| Step Description | Observations |
|---|---|
| Follow the navigation path: Home → Catalog → Shared Folders → Data Quality Visualization à Data Quality à Data Quality Registry |
 |
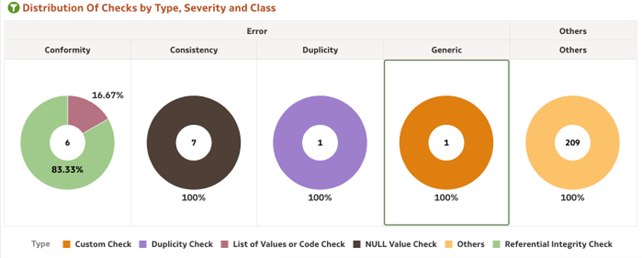
- Distribution Of Checks by Type, Severity and Class (Donut Chart): Number of DQ checks organized by Severity, Class and Type names for each source table column, in a donut chart layout. Severity and Class names are visually represented within separate trellis columns, and Type segregated by color providing a clear depiction of their distribution and relationship.
- Activity - Results Data Browsing
- Objective: to provide a comprehensive view of the distribution of Data Quality (DQ) checks by severity, class, and type across source table columns.
- Persona: Business Analyst
Table 4-7 Distribution of Checks by Type, Severity, and Class
| Step Description | Observations |
|---|---|
| Follow the navigation path: Home → Catalog → Shared Folders → Data Quality Visualization à Data Quality à Data Quality Registry |
 |
