8.1.3.3 Mitigants Summary
This pre-built report, based on the Mitigants subject area, offers a comprehensive view of risk reduction strategies implemented across products, branches, and regions. It aids in evaluating the effectiveness of various mitigants, identifying exposure gaps, and enhancing risk management practices.
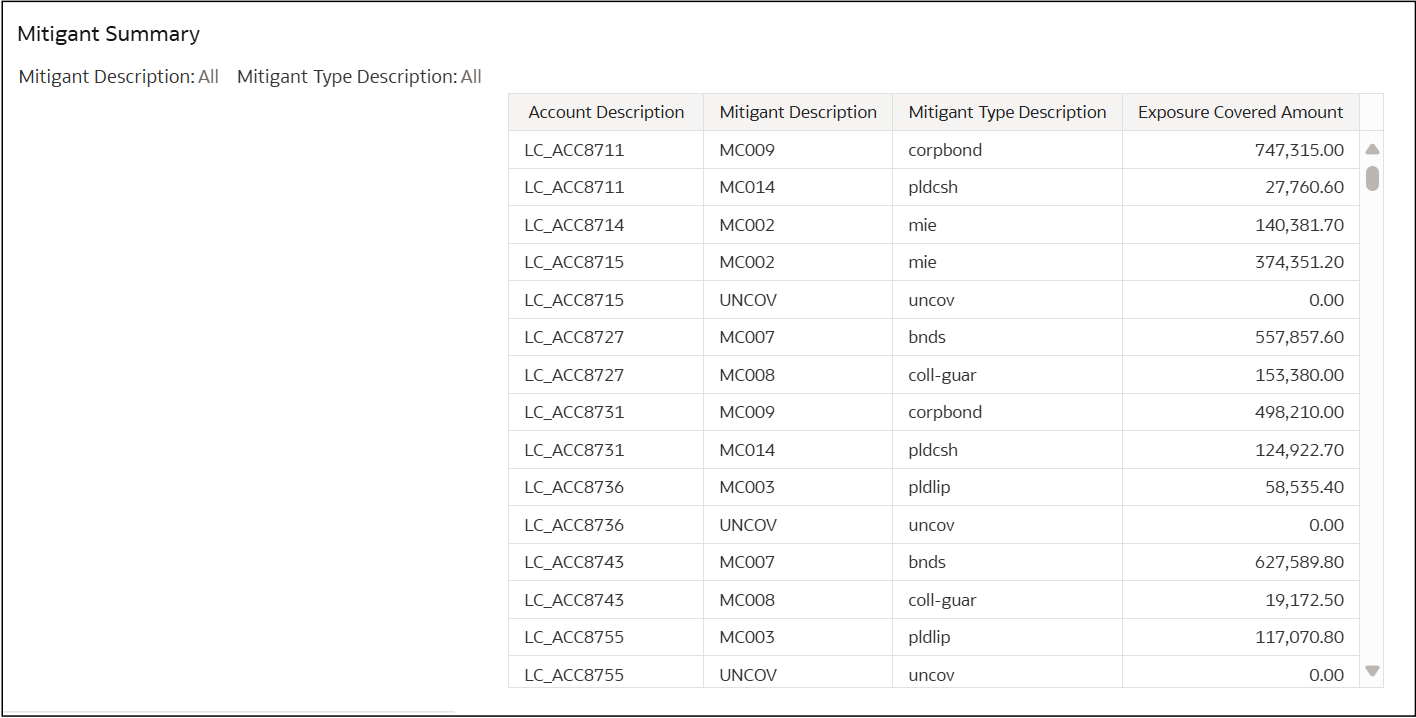
Mitigant Summary
A mitigant summary table displays various mitigating factors or actions designed to reduce risk or exposure. In financial contexts, this could refer to strategies or assets that reduce the risk associated with liabilities, investments, or other financial obligations.
Figure 8-58 Mitigant Summary

Types of Mitigants Received
Figure 8-59 Types of Mitigants Received

- Trends in mitigant effectiveness
- Shifts in risk exposure
- Performance benchmarking of mitigant types
Specific Product Risk Coverage – Trend Analysis
Figure 8-60 Specific Product Risk Coverage – Trend Analysis

- Visibility into changes in product-level exposure
- Evaluation of mitigant impact over time
- Strategic input for improving product-specific risk handling
Covered vs. Uncovered Amounts by Branch
Figure 8-61 Covered vs. Uncovered Amounts by Branch

- Branch-level exposure visibility
- Effectiveness of mitigants at individual locations
- Identification of high-risk branches for further action
Product-wise Risk Coverage Across Branches
Figure 8-62 Product-wise Risk Coverage Across Branches

- Detailed branch-level performance by product type
- Coverage adequacy and gaps
- Data to support localized mitigation strategies
Regional Product Distribution Dashboard
Figure 8-63 Regional Product Distribution Dashboard

- Product demand by geography
- Regional risk profiles
- Market segmentation and strategic planning inputs