8.2.4.2.1 Customer Account Summary
This pre-built report is based on Accounts subject area. It provides stakeholders with an overall summary of credit status of institution's assets such as loans as of the selected date.
Credit Status: This provides a view of end-of-period balance in the
reporting currency by credit status across regions and branches. It enables stakeholders
to assess the health of credit portfolios and identify areas requiring attention. This
helps in monitoring regional and branch-level credit performance and risk exposure and
helps identifying if any specific region or branch needs attention.
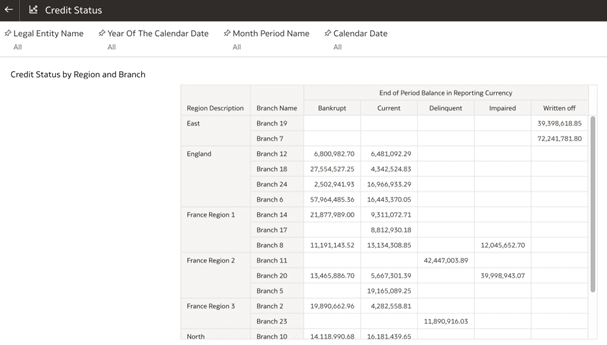
Figure 8-43 Credit Status

Non Performing Assets: Provides a visual representation of non
performing assets (NPAs), where definition of non performing asset is as per
jurisdictional regulator and user provides data marking accounts as NPA. This
visualization is based on across regions using bar charts. It offers insights into the
distribution and health of non-performing assets (NPAs) by region.
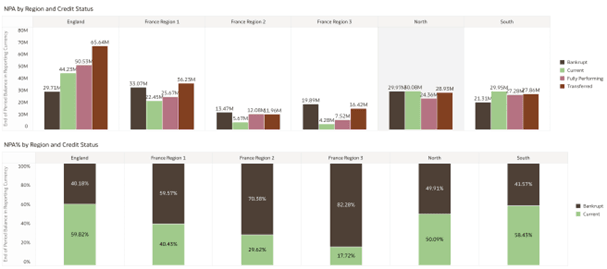
Figure 8-44 Non Performing Assets

Asset Position Dashboard - This dashboard provides a quick overview
of how assets are diversified by both business type and legal entity,
highlighting the differences across the institution. It can guide strategic focus,
resource allocation, and risk assessment. The below pre-built report displays the
following details.
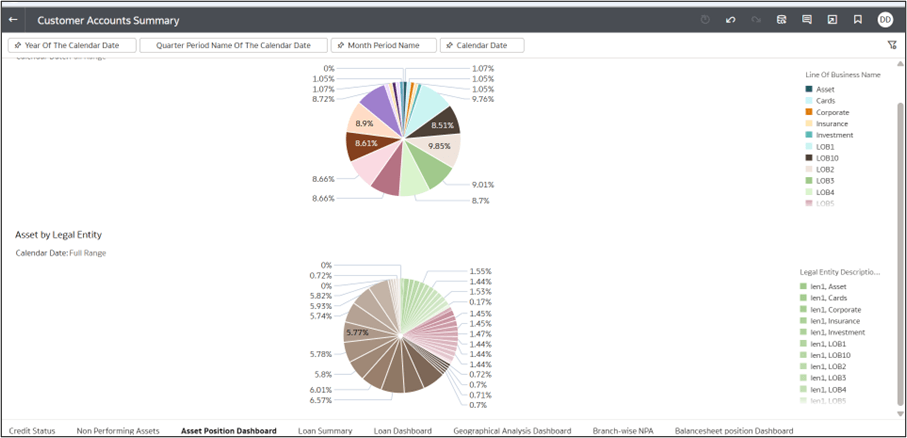
Figure 8-45 Asset Position Dashboard

1. Asset by Business Type
- Shows how assets are spread across various Lines of Business (LOB).
- Displays asset allocation by Legal Entities.
Loan Summary - This dashboard displays detailed information about various loan
accounts as of date, including credit limits, loan types, statuses, and balance
metrics.
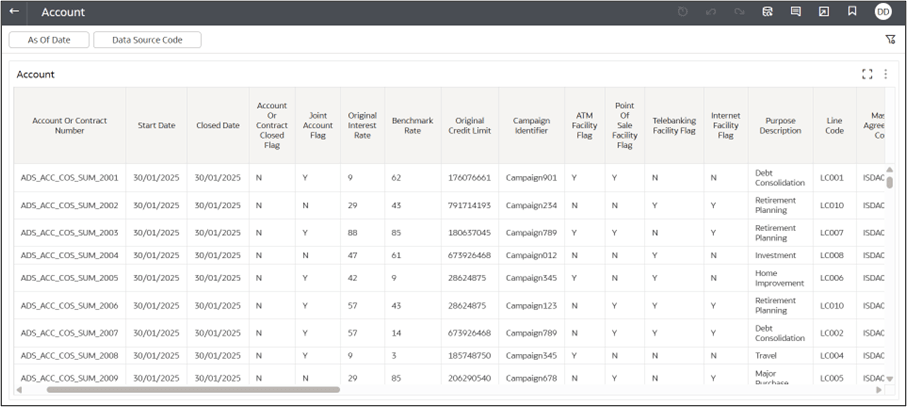
Figure 8-46 Loan Summary

Loan Dashboard - This dashboard visualizes loan data by product for Q1
of the selected year, focusing on two key financial metrics: The below pre-built report
displays the following details.
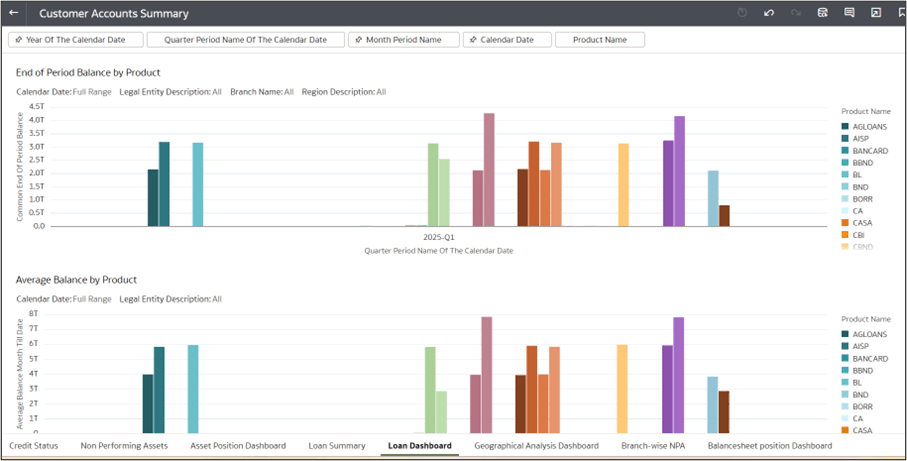
Figure 8-47 Loan Dashboard

- 1. End of Period Balance by Product
This chart shows the outstanding loan balances at the end of the quarter for each product.
- 2. Average Balance by Product
This chart shows the average outstanding balance till date:
Geographical Analysis Dashboard - The dashboard is split into sections based on
different analyses:
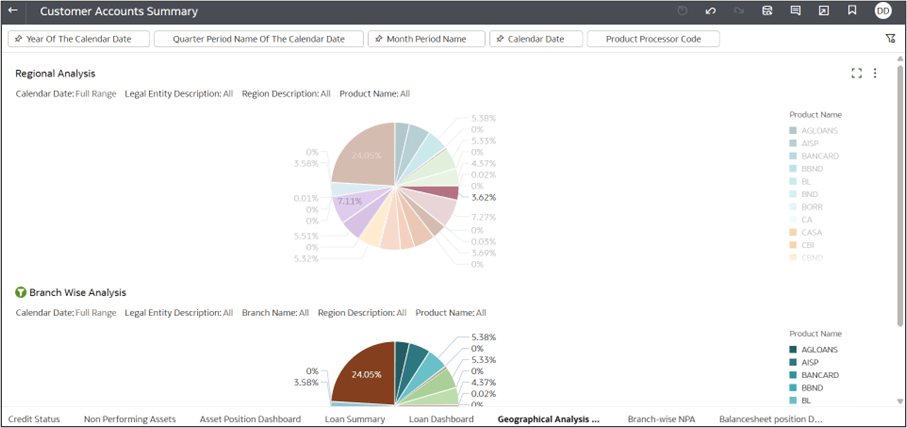
Figure 8-48 Geographical Analysis Dashboard

- Regional Analysis: Analyzes the distribution of products or other variables across different regions.
- Branch Wise Analysis: Focuses on breaking down data across various branches.
- Other Analysis: It also includes geographical, loan, and asset position analyses.
- At the top of the screen, you can apply filters to narrow down your analysis:
- Calendar Date (Full Range): Allows you to view data over any chosen time frame (year, quarter, or month).
- Legal Entity Description: Provides options for selecting the legal entities you want to focus on.
- Region Description: Filter data by different regions.
- Product Name: You can filter data based on product types.
- Hovering over each slice of the pie chart will give you more detailed numerical data (percentages).
Branchwise NPA - This displays the distribution of non-performing
assets (NPAs) across branches for a particular region, segmented into various credit
status categories such as Bankrupt, Impaired, Written Off, and
Delinquent. This chart provides a view of NPA composition for each branch,
enabling stakeholders to quickly assess and compare the extent and type of financial
risk across different branches of a given region. This is especially helpful if user
sees unexpected data for a given region in previous visualization, and wants to view
data spread across branches for that region.
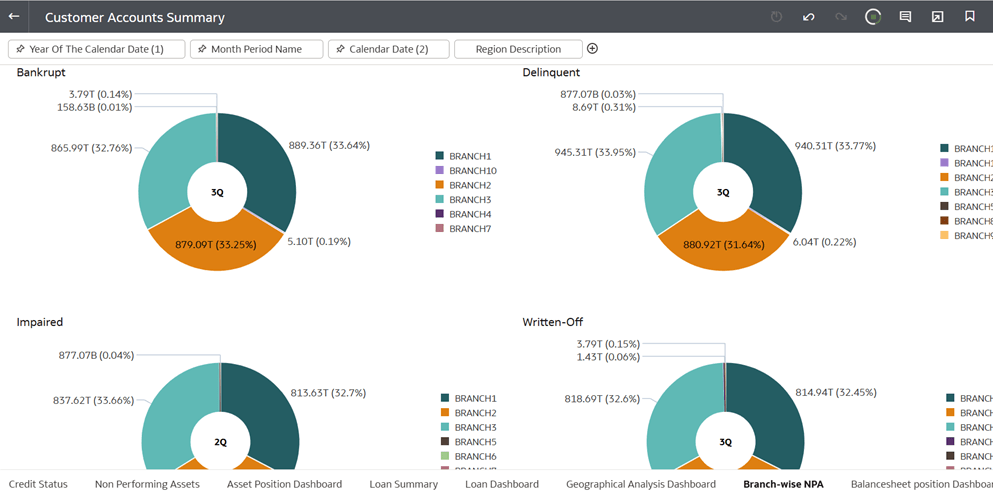
Figure 8-49 Branchwise NPA

Balance Position Dashboard
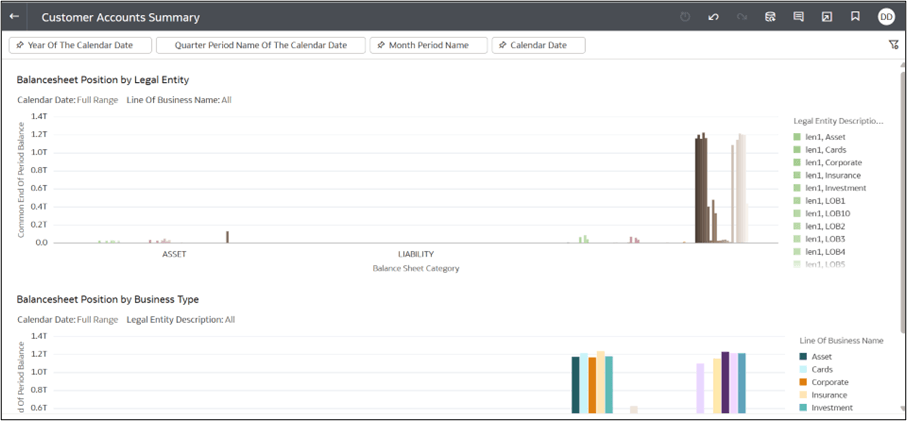
Figure 8-50 Balance Sheet Position

1. Balance Sheet Position by Legal Entity:
- This section shows the Common End of Period Balance across various Legal Entities, broken down by balance sheet category by assets and liabilities.
- This section uses the Line of Business (LOB) breakdown to represent the balance sheet positions.
- Balance Sheet Category (Asset vs. Liability): Similar to the first chart, you can see the split between assets and liabilities for each business type.