8.2.4.2.2 Accounts – Derivatives Summary
This pre-built report, based on the Accounts subject area, delivers a high-level snapshot of an institution’s derivative exposure portfolio as of a specific date. It offers valuable insights into notional values and market positions, , enabling stakeholders to monitor portfolio positions of different types of derivatives effectively.
Tabular Data (Value by Product and Instrument Type)
Table 8-4 Value by Product and Instrument Type
| Instrument Type | Forwards | Future | Options | Swaps | Credit Derivative |
|---|---|---|---|---|---|
| Equity | 1,944,377 | 3,119,470 | 1,223,422 | 1,682,143 | 1,765,732 |
| Commodity | 1,745,131 | 2,157,887 | 1,399,406 | 1,567,381 | 411,408 |
| Forex | 1,219,397 | 2,892,709 | 1,034,113 | 1,269,609 | 758,671 |
| Interest Rate | 682,596 | 2,134,086 | 1,225,732 | 1,155,755 | 807,296 |
| Credit | 918,443 | 1,223,291 | 855,056 | 1,434,478 | 725,108 |
Table 8-5 Fair Value by product and Instrument Type
| Instrument Type | Instrument Type Description | Forwards | Future | Options | Swaps | Credit Derivative |
|---|---|---|---|---|---|---|
| Equity | Positive Fair Value | 1599271.3 | 966806.5 | 823363.2 | 786198.6 | 416055 |
| Equity | Negative Fair Value | -14873.2 | -30692.1 | -15208.8 | -11493.7 | -253309 |
| Commodity | Positive Fair Value | 1491224.1 | 1528794.3 | 1759512.7 | 2025793 | 793067 |
| Commodity | Negative Fair Value | -11835.9 | -37570.2 | -41187.1 | -21249.5 | -357225 |
| Forex | Positive Fair Value | 623486.6 | 847360.8 | 606367.3 | 824300.4 | 662408 |
| Forex | Negative Fair Value | -33700.4 | -13255.7 | -11020.6 | 0 | 0 |
| Interest Rate | Positive Fair Value | 1126196.5 | 777706.6 | 1478005.8 | 803262.9 | 346157 |
| Interest Rate | Negative Fair Value | -14886.7 | -47041.4 | -14092.5 | 0 | -323767 |
| Credit | Positive Fair Value | 1276353.1 | 429605 | 704020.9 | 768750.4 | 315706 |
| Credit | Negative Fair Value | -14886.7 | -16610.2 | 0 | 0 | 0 |
Derivative Performance Tracker
Figure 8-51 Derivative Performance Tracker
Derivative Performance Tracker by Instrument Type
Figure 8-52 Derivative Performance Tracker by Instrument Type
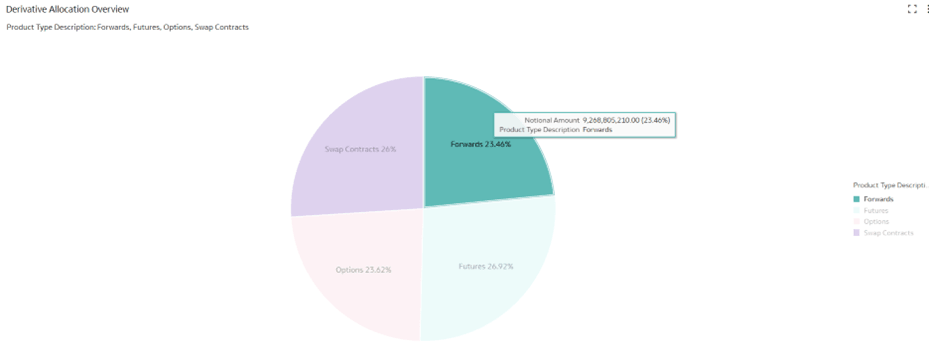
Derivative Allocation Overview
Figure 8-53 Derivative Allocation Overview

- Visual assessment of asset allocation
- Highlights concentration risks
- Supports diversification efforts
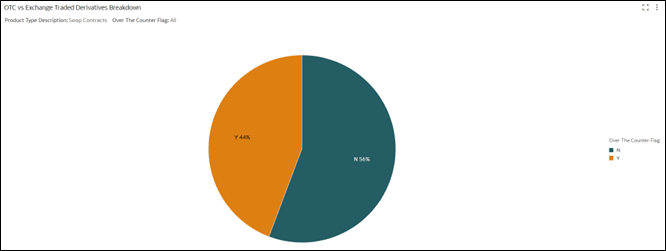
OTC vs. Exchange-Traded Derivatives Breakdown
Figure 8-54 OTC vs Exchange Traded Derivatives Breakdown

- Highlights potential credit and counterparty risks associated with OTC Derivatives
- Aids in assessing risk mitigation needs
Instrument Type Distribution
Purpose: Helps visualize proportion of each category of derivative based on underlying instrument type within the whole portfolio.
Figure 8-55 Instrument Type Distribution

- Detects over-concentration and potential risk hotspots
- Enables proactive rebalancing and enhanced risk control