8.2.6 Balance Reconciliation Visualizations
The GL Reconciliation process ensures that balances from a bank's operational systems (typically standard product processor entities) are reconciled with the General Ledger (GL) balances.
- Reconciliation Dashboard
- Reconciliation Execution Summary – Displays the execution summary of the specified criteria.
- Reconciliation Differences – Highlights discrepancies between operational balances and GL balances.
- Adjustments Summary – Displays adjustments made to correct discrepancies.
- Threshold Breach
- Threshold Breach Summary – Identifies instances where reconciliation variances exceed predefined thresholds.
- Global Threshold Breach Summary - The Global Threshold Breach Summary provides a consolidated view of data quality issues where checks have exceeded pre-defined acceptable limits (thresholds).
- Threshold Definition Summary - The Threshold Definition Summary outlines the rules and acceptable limits set for data quality checks. These thresholds determine whether a particular check passes or fails, based on predefined business or regulatory standards.
- Map Filter Report
- Reconciliation Source Filters help users narrow down data quality checks to specific source systems involved in reconciliation.
- Reconciliation Target Filters allow users to refine data quality results based on the target system or dataset involved in reconciliation. These filters help identify where mismatches or data quality issues occur on the receiving side of a reconciliation process.
- Reconciliation Dimensions define the key attributes used to match and compare data between source and target systems. These dimensions determine how records are grouped, aligned, and validated during reconciliation processes.
- On the Home page, navigate to the Data Visualization > GL Reconciliation Dashboard. The Reconciliation Framework Analytics screen is displayed.
- Click on Dashboards to view GL reconciliation results.
Accessing GL Reconciliation Dashboards
To view the GL Reconciliation Dashboards, follow these steps:
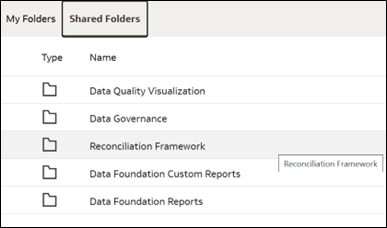
- Navigate to Shared Folders.
- Select Reconciliation Framework.
- Click on Dashboards to access the reconciliation results.
GL Reconciliation Results – Data Visualization Reports:
Within the Data Visualization Reports, users can navigate through the following canvases:
- Home – Overview of reconciliation results.
- Threshold Breach – Displays instances where reconciliation variances exceed predefined limits.
- Map Filter Report – Provides a detailed view of reconciliation
mappings and applied filters.
Figure 8-110 Access GL Reconciliation in DFCS

For further details on using dashboards, refer to the Oracle® Financial Services Data Foundation Cloud Service for Banking Data Controls User Guide.