16.3.2 KIs by Regulatory Reports
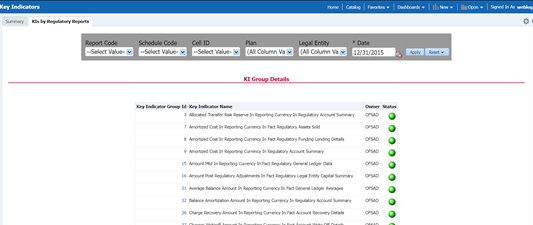
The KIs by Regulatory Reporting page displays the Key Indicator Group Details with the following columns:
- Key Indicator
- Name
- Owner
- Status
To view the above-mentioned column values for a particular report, select the
required report name in the Plan drop-down box, and column name
in the Legal Entity dropdown box. Click
Apply. A list of KI Group Details appears.

Figure 16-34 KIs by Regulatory Reporting

For the required Key Indicator, to view the Variance Analysis, Validation Check Analysis, and Trend Analysis, click any Key Indicator number. These details appear at the bottom of the page:
- Variance Analysis: Variance Analysis provides these data for
the selected report:
- Report: Displays the reporting line item for the selected report.
- Schedule: Displays the schedule code for the respective reporting line item.
- Cell Reference: Displays the cell ID for the respective
reporting line item.
- KI Condition: Displays the KI condition name.
- Current Value: Provides the current period value for the respective Reporting line item.
- Previous Value: Provides the previous period value for the
respective Reporting line item.
- Variance %: Displays the percentage of Variance based on Previous Value.
- Status: The status of the selected Key Indicators depending on the various values.
- Dependent KIs: Displays the other Key Indicators on which
this cell ID is dependent.
To view the Assessment details of the selected Key Indicator, click Dependent KIs. The Assessment Details page appears.
- Validation Checks: Displays all the Value-based Key
Indicators associated with that Key Indicator Group key. For the selected report,
these details appear:
- Report: Displays the reporting line item for the selected report.
- Schedule: Displays the schedule code for the respective
reporting line item.
- Cell Reference: This displays the cell ID for the respective reporting line item.
- KI Condition: Displays the KI condition name.
- Status: The status of the selected Key Indicators depending
on the various values.
- Dependent KIs: Displays the other Key Indicators on which this cell ID is dependent.
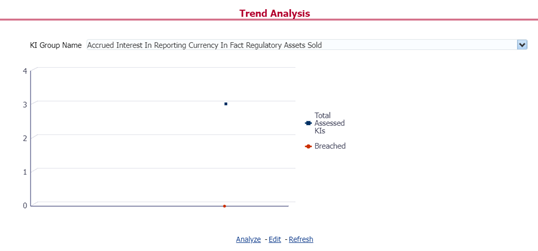
- Trend Analysis: Displays the trend of total assessed Key
Indicators and breached Key Indicators for a particular time interval.
Figure 16-35 Trend Analysis
