16.2.1.2 Quality Control Effectiveness Trend
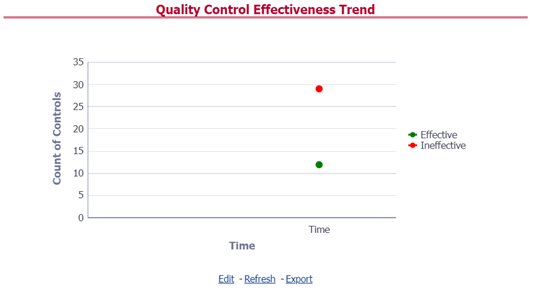
This section provides the graphical representation of the Number of Quality Controls within six months from the selected date.
Figure 16-22 Quality Control Effectiveness Trend

Click the graphs to view the drill-down Control Assessment reports.
The following data appears under the Control Assessment dashboard:
- Control ID
- Control Name
- Number of DQ checks
- Assessment ID
- Assessment Date
- Effective Score
- Rating Name
Click Assessment ID to view the drill-down Control Parameter Score.