16.2.1.1 Quality Controls by Rating
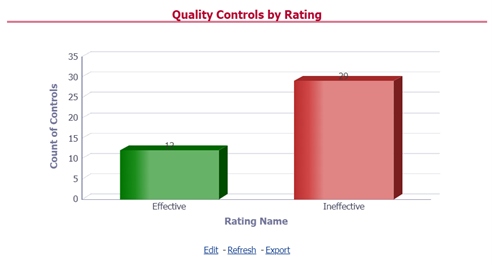
This section provides the graphical representation of the Number of Controls against Quality Controls. The following are the types of Rating Names:
- Effective
- Ineffective
Figure 16-19 Quality Controls by Rating

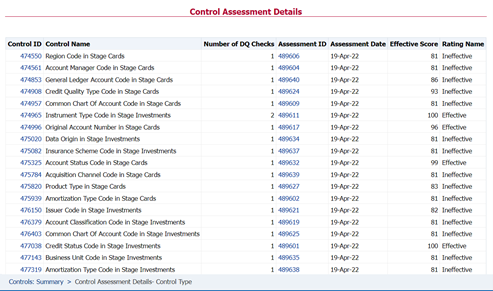
Click the graphs to view the drill-down Control Assessment reports. The following data appears under the Control Assessment Details dashboard:
- Control ID
- Control Name
- Number of DQ checks
- Assessment ID
- Assessment Date
- Effective Score
- Rating Name
Figure 16-20 Control Assessment Details

In the Assessment ID column, click the required link to view the drill-down Control
Parameter Score.

Figure 16-21 Control Parameter Score
