10.1 Basic Scenario
To create a variation, follow these steps:
- Navigate to the OBIEE Dashboard page of What-If Analysis.
- Click Create Scenario after selecting the relevant dimensions
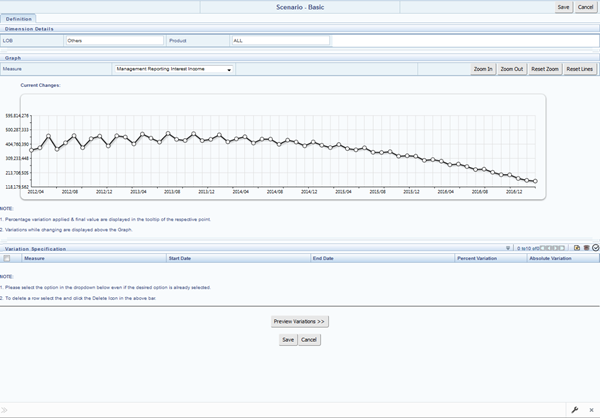
to display the Scenario - Basic screen.
Figure 10-1 Basic Scenario

- Apply the necessary Dimension Details for the following:
- Account
- Customer
- LOB
- Product
- Select the relevant repline Measure from the drop-down list to which you want to apply the variation.
- Select a point on the graph and drag to apply the desired variations. Percentage variation and applied, final values in the drop-down are displayed on the graph and as a tooltip on the point that is being changed.
- Select the relevant details for the following under the Variation
Specification section of the screen.
- Measure
- Start Date
- End Date
- Percent Variation: Enter the % value. If you enter this, you cannot enter the Absolute Variation.
- Absolute Variation: Enter the absolute value. If you enter this, you cannot enter the Percent Variation.
If there is an overlap in dates among various variation specification rows, the same can be overridden to apply the respective change.
Always the most recent changed value is considered for variation and the other value will be cleared.
- Click Preview Variations to see the results.
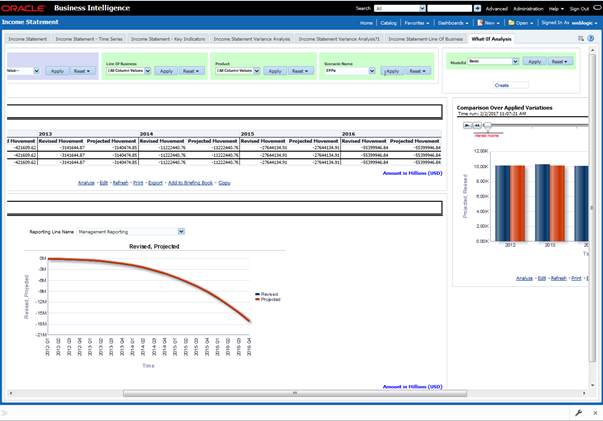
- Click Save after confirming the variations. After this, you will be redirected to the OBIEE screen where the applied variations can be seen and analyzed further.
The OBIEE screen is displayed as follows:

Figure 10-2 OFS EFPA BI – Income Statement Basic
