Customer 360
Based on the Segment filter prompt selected the reports are generated. The options available under the Segment filter prompt are as follows:
- Risk-Based
- Demographics
- Behavioral
- Profitability
Figure 4-29 Customer 360 Filters

The maximum number of measures/dimensions that can be selected is 15. On selecting more than 15 measures/dimensions, the first selected dimensions in the hierarchy are deselected.
Figure 4-30 Retail Profile

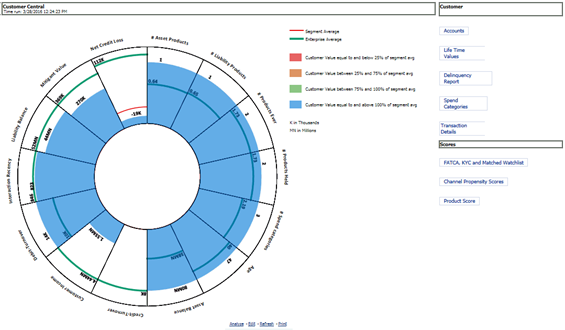
Customer Central (Sunburst-Wheel): This report displays a circular graphical representation that is divided into several sectors. Each sector represents the value of the dimension or measure, that is, Turnover, Customer Since, Total Asset Balance, Total Liability Balance, No. of Asset Product, No. of Liability Product, No. of Products Held (currently), No. of Products Held (Since the inception of the customer), Debit Turnout, Mitigant Value, Total Spent, and so on, of the customer that has been selected. This is a sunburst report. On clicking a particular segment, the selected segment rotates and appears on the top part of the circle for better visualization.
The radial axis on the anti-clock side of every sector represents the scale for that sector. The following values are represented in each sector:
- Customer Value: This represents the dimensional value of customers across the scale.
- Segment Average: This represents the average value of the dimension of the segment that the customer belongs to.
- Enterprise Average: This represents customers from all the segments considered to compute the average value of dimension or measure.
Figure 4-31 Customer Central
