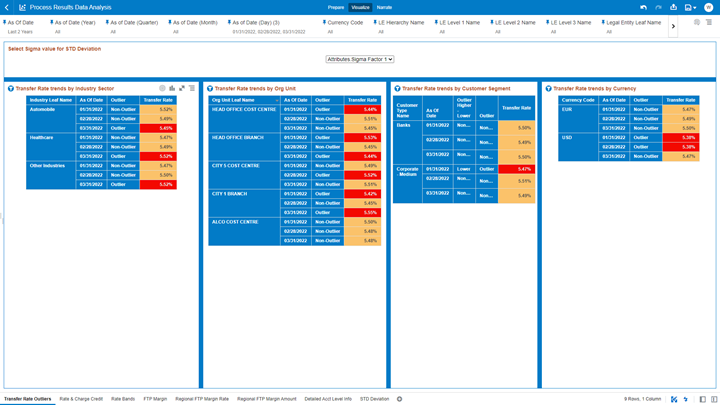
7.1.6.1.4 Transfer Rate Outliers
This canvas allows you to look at the Transfer Rate Outliers that are calculated using the Standard Deviation capability available off the shelf with Oracle Analytics.
The Transfer Rate pertaining to the Instrument level data is segregated between “Outlier” and “Non-Outlier” in the report column “Outlier”.
“Outlier” in this case refers to the Transfer Rate, for a particular subset related to a combination of Dimensional Values that lie outside the confidence interval of the deviation that we are adopting in our technique.
“Non-Outlier” would refer to the Transfer Rate, for a particular subset related to a combination of Dimensional Values that lie inside the confidence interval of the deviation.
The outliers are calculated on the Transfer Rate aggregated by the respective combination of Dimensional Values, such as Industry, Org Unit, Customer Segment, and Currency against the As-of-Date available.
Figure 7-142 “Transfer Rate Outliers” Report Canvas

The Transfer Rate can be identified as an Outlier or a Non-Outlier based on the standard deviation confidence interval that we adopt.
This confidence interval is parametrized with the list of the Sigma values available in the report that is “Attributes.Sigma Factor 1”, “Attributes.Sigma Factor 2”, and “Attributes.Sigma Factor 3”.
The Sigma Factors are integer values that range from “Attributes.Sigma Factor 1” to “Attributes.Sigma Factor 3” in the increasing order of the conservativeness or the confidence interval of the Standard Deviation.
This means will have more outliers when you perform analysis with “Attributes.Sigma Factor 1” than with the “Attributes.Sigma Factor 3”.
The following screenshot shows the selection for the Sigma Factor available in the report canvas.
Figure 7-143 Sigma Factor selection for STD Deviation

You can use a series of Report Prompts, as previously described, to filter the data according to Key Attributes pertaining to the underlying Instrument level data.
The report displays the underlying Instrument account data according to the following Charts’ logic:
- Select Sigma Value for STD Deviation: The chart provides you with a selection capability for the desired Sigma value to be used by the STD Deviation, the possible selection values are “Attributes.Sigma Factor 1”, “Attributes.Sigma Factor 2”, and “Attributes.Sigma Factor 3”.
- Transfer Rate trends by Industry Sector: This
chart deduces if the Transfer Rate related to the different Industry Sectors is an
“Outlier” or “Non-Outlier” for a combination of As-of-Date and Industry Leaf Name.
The columns displayed in the chart are as follows:
- Industry Leaf Name
- As Of Date
- Outlier
- Transfer Rate
- Transfer Rate trends by Org Unit: This chart deduces if the
Transfer Rate related to the different Org Units is an “Outlier” or “Non-Outlier”
for a combination of As-of-Date and Org Unit Leaf Name.
The columns displayed in the chart are as follows:
- Org unit Leaf Name
- As Of Date
- Outlier
- Transfer Rate
- Transfer Rate trends by Customer Segment: This chart deduces
if the Transfer Rate related to the different Customer Segments is an “Outlier” or
“Non-Outlier” for a combination of As-of-Date and Customer Type Name.
The columns displayed in the chart are as follows:
- Customer Type Name
- As Of Date
- Outlier
- Transfer Rate
- Transfer Rate trends by Currency: This chart deduces if the
Transfer Rate related to the different Currencies is an “Outlier” or “Non-Outlier”
for a combination of As-of-Date and Currency Code.
The columns displayed in the chart are as follows:
- Currency Code
- As Of Date
- Outlier
- Transfer Rate