2.7 Scheduler Service Dashboard
To access the Scheduler Service Dashboard, complete the following steps:
- From the left menu, click Common Object Maintenance.
- Select Operations and select Dashboard.
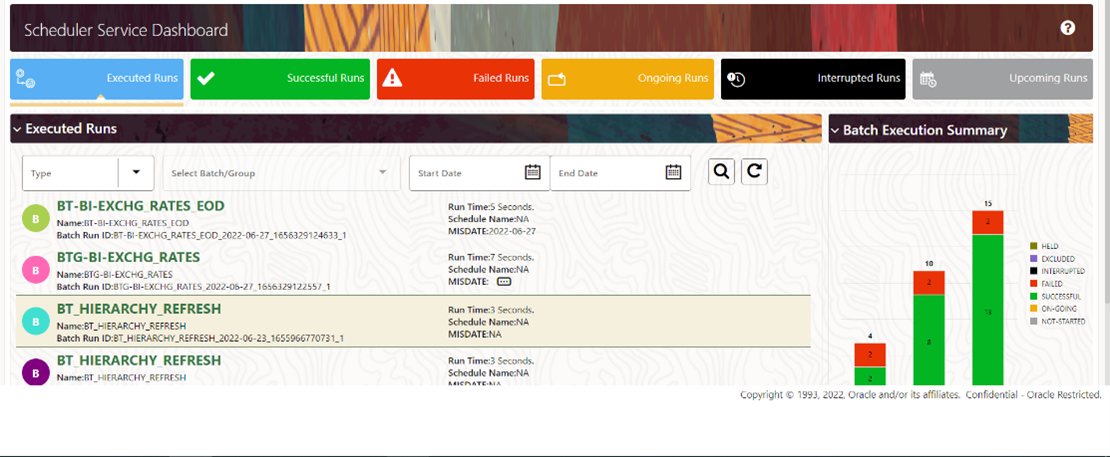
The Scheduler Dashboard containing the following details is displayed.
Figure 2-8 Scheduler Service Dashboard

In the Scheduler Service Window, you can view the following details:
The Executed Runs, Successful Runs, Failed Runs, Ongoing Runs, Interrupted Runs, and Upcoming Runs tabs. You can click the tabs to view the details of the Batches based on their status. For example, click Ongoing Runs to view the details of the batches that are currently running.
The Batches that were executed within the last 7 or 30 days contain details such as Batch Name, Batch Run ID, and Run Time. Click 30 days to view the batches that were executed within the last 30 days. You can click the icon corresponding to a Batch to monitor it.
The Batch Execution Summary Pane displays the count of total batches executed that were executed within the last 7 days, 30 days, and 120 days. Additionally, you can see the separate count of successful batches, failed batches, interrupted batches, on-going batches, and the batches which are yet to start, by hovering your mouse the batches.