6.3.4 Product Tab
The Product tab includes reports that focus on the Key Performance Indicators for each Product. The filters for this tab allow the report results to be focused on selected combinations for comparison and targeted analysis.
The filters include:
- Time
- Company
- Product
- Region
The various reports available under this tab are detailed in the following sections.
Claim Ranking by Product
Figure 6-163 Claim Ranking by Product

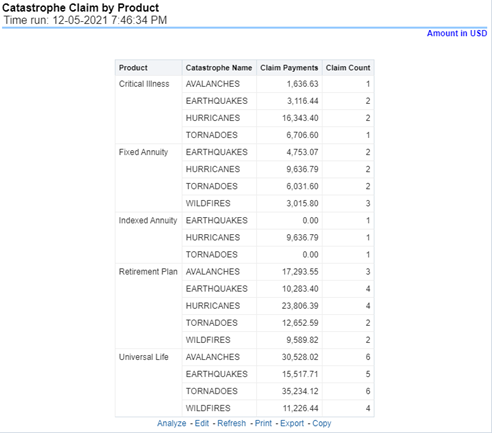
Catastrophe Claim by Product
Figure 6-164 Catastrophe Claim by Product
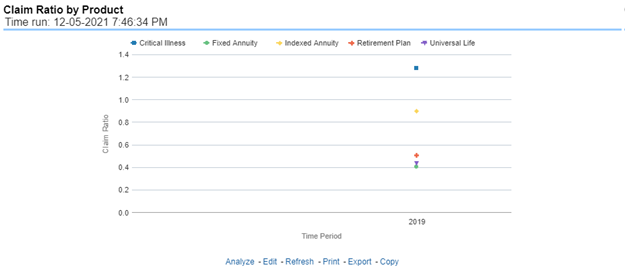
Claim Ratio by Product
Figure 6-165 Claim Ratio by Product
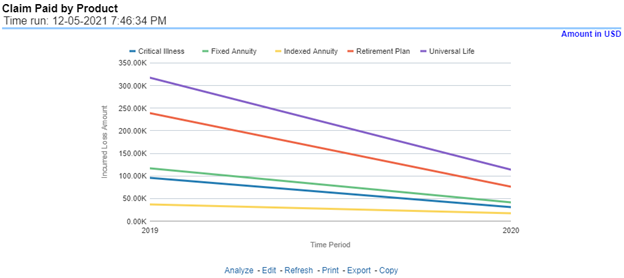
Claim Paid by Product
Figure 6-166 Claim Paid by Product
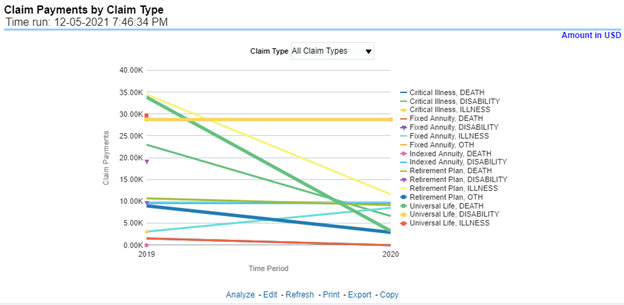
Claim Payments by Claim Type
Figure 6-167 Claim Payments by Claim Type
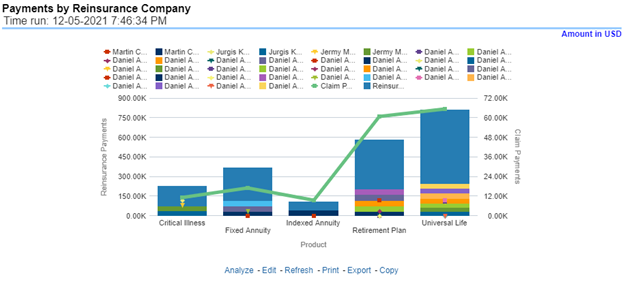
Payments by Reinsurance Company
Figure 6-168 Payments by Reinsurance Company
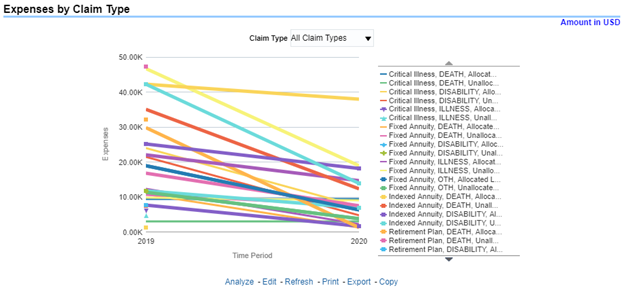
Expenses by Claim Type
Figure 6-169 Expenses by Claim Type
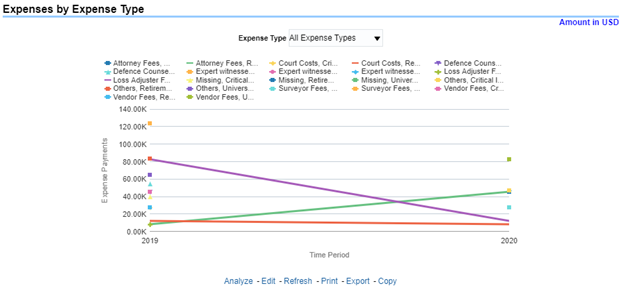
Expenses by Expense Type
Figure 6-170 Expenses by Expense Type
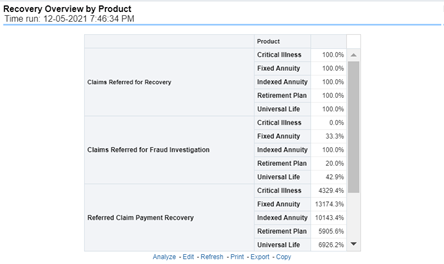
Recovery Overview by Product
Figure 6-171 Recovery Overview by Product
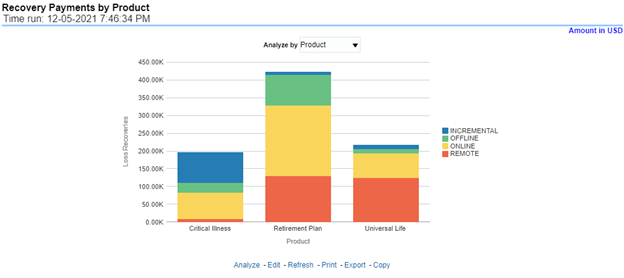
Recovery Payments by Product
Figure 6-172 Recovery Payments by Product
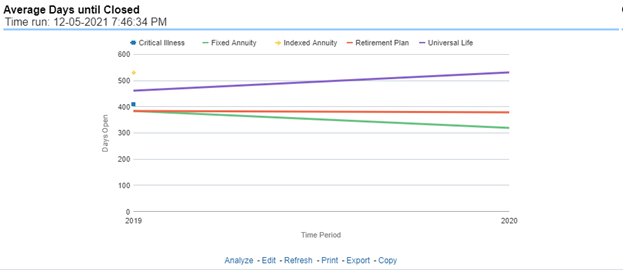
Average Days until Closed
Figure 6-173 Average Days until Closed
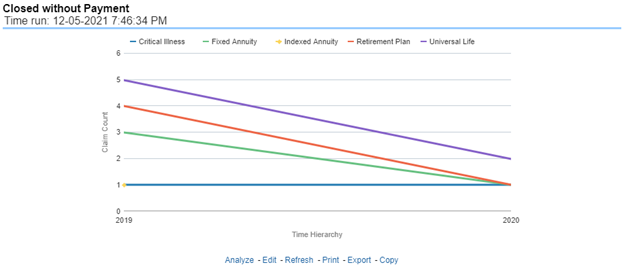
Claims Closed without Payment
This report is a time-series line graph that illustrates the count of claims that were closed during the reporting period without any claim payments generated for the claim.
Figure 6-174 Claims Closed without Payment
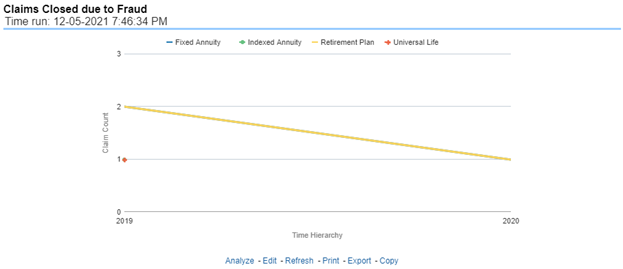
Claims Closed Due to Fraud
Figure 6-175 Claims Closed Due to Fraud
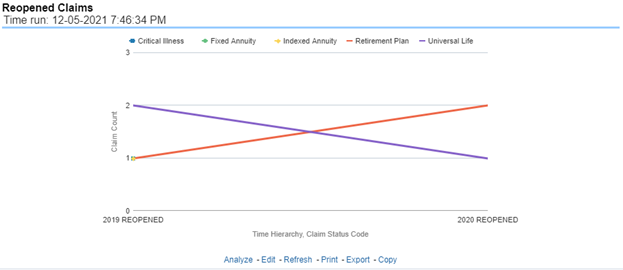
Reopened Claims
Figure 6-176 Reopened Claims
Litigation Claims
Figure 6-177 Litigation Claims
