6.3.1 Summary Tab
The Summary tab includes information at the corporate level. The information contained in the reports generated summarizes how the entire organization is performing.
The filters include:
- Time
- Company
- Catastrophe
- Region
The various reports available for this tab are discussed in the following sections.
Key Claim Performance Indicators Flash
Figure 6-128 Key Claim Performance Indicators Flash

Claim Geographical Map
Figure 6-129 Claim Geographical Map

Claim Frequency Map
Figure 6-130 Claim Frequency Map

Top Ten Geographical Regions for Claim Payments
Figure 6-131 Top Ten Geographical Regions for Claim Payments

Top Ten Geographical Regions for Claims Reported
Figure 6-132 Top Ten Geographical Regions for Claims Reported

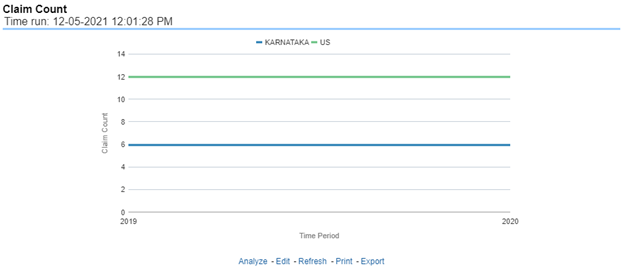
Claim Count
Figure 6-133 Claim Count
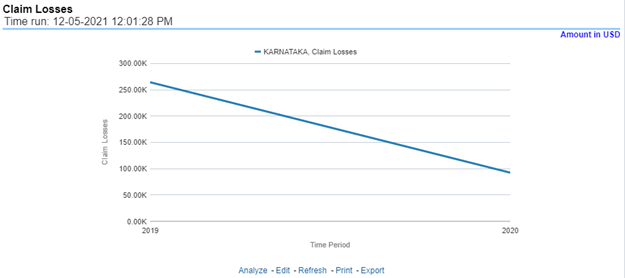
Claim Losses
Figure 6-134 Claim Losses
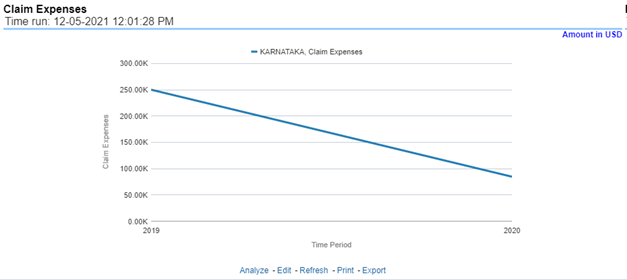
Claim Expenses
Figure 6-135 Claim Expenses
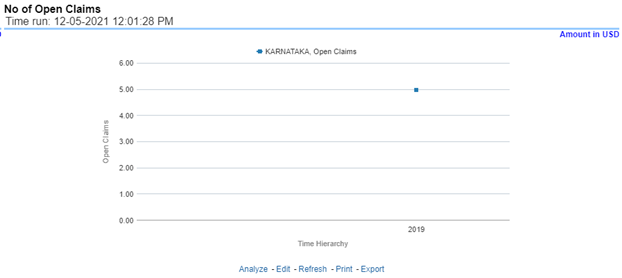
Number of Open Claims
Figure 6-136 Number of Open Claims
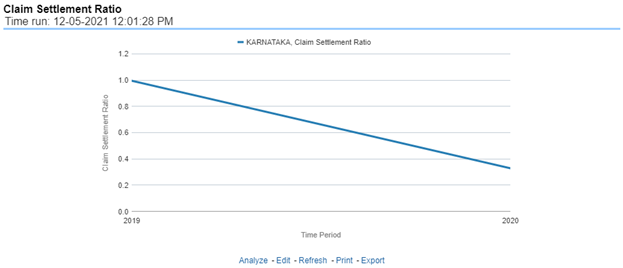
Claim Settlement Ratio
Figure 6-137 Claim Settlement Ratio
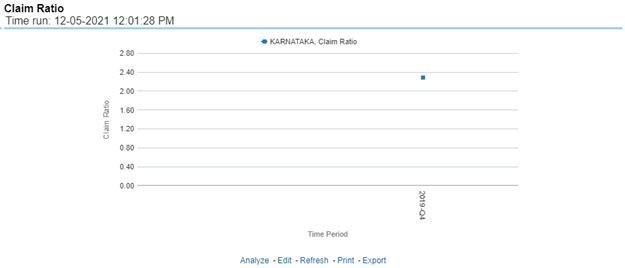
Claim Ratio
Figure 6-138 Claim Ratio
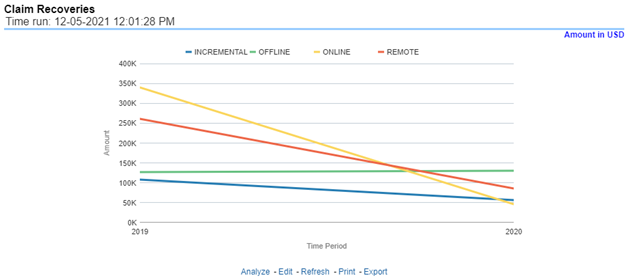
Claim Recoveries
Figure 6-139 Claim Recoveries
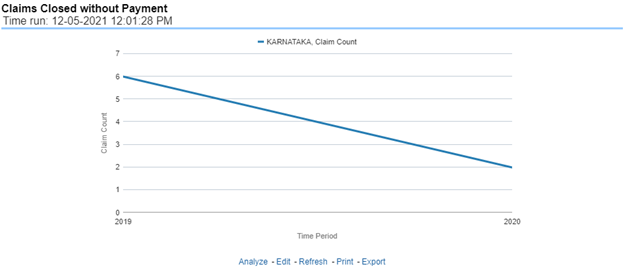
Claims Closed without Payment
This report is a time-series line graph that illustrates the count of claims that were closed during the reporting period without any payments generated for the claim.
Figure 6-140 Claims Closed without Payment
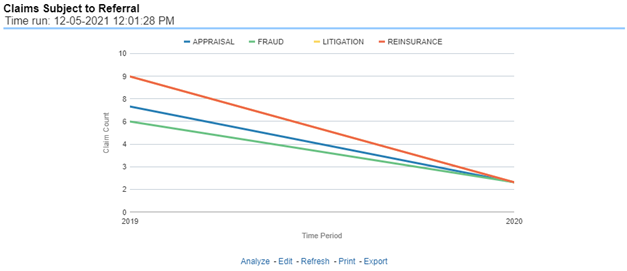
Claims Subject to Referral
Figure 6-141 Claims Subject to Referral
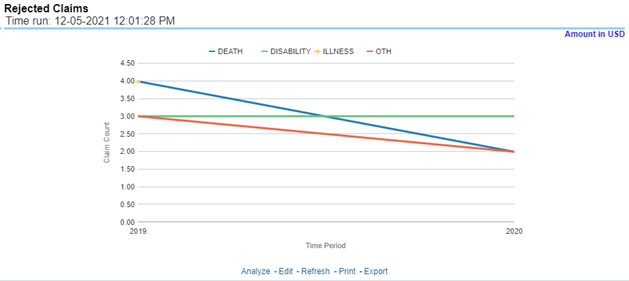
Rejected Claims
Figure 6-142 Rejected Claims
