6.1.5 Product Overview Tab

The Product tab includes reports that focus on the overview of Performances for Products. The filters for this tab allow the report results to be focused on selected products for comparison and targeted analysis.

The filters include:

  • Time
  • Company
  • Lines of Business
  • Products
  • Region

The various reports available under this tab are discussed in the following sections.

Customer Distribution by Policy Status

This report provides customer and policy information through time series. Various performance metrics-based measures, for example, the Number of New Customers, the Number of Closed Customers, and so on for the reporting period selected, are displayed on a year-on-year basis. This report can be analyzed over various periods, entities, regions, products, and lines of business selected from page-level prompts.

Figure 6-47 Customer Distribution by Policy Status


Customer Distribution by Policy Status

Top 10 Products for In-force Premium and Policy Count
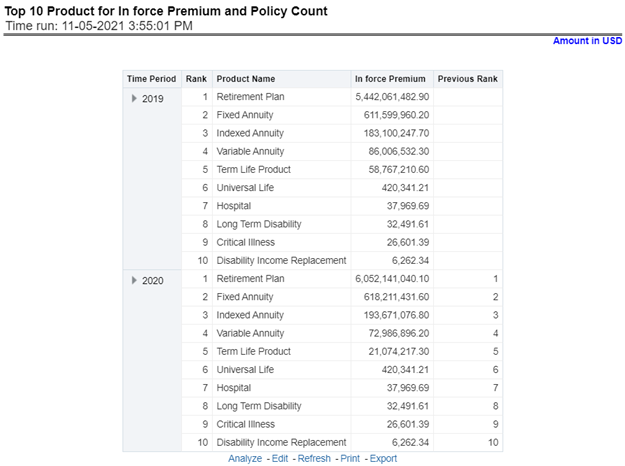
This report provides ranking for Top 10 products in terms of in-force written premium and policy count with previous period ranking.

Figure 6-48 Top 10 Products for In-force Premium and Policy Count

Top 10 Products for In-force Premium and Policy Count

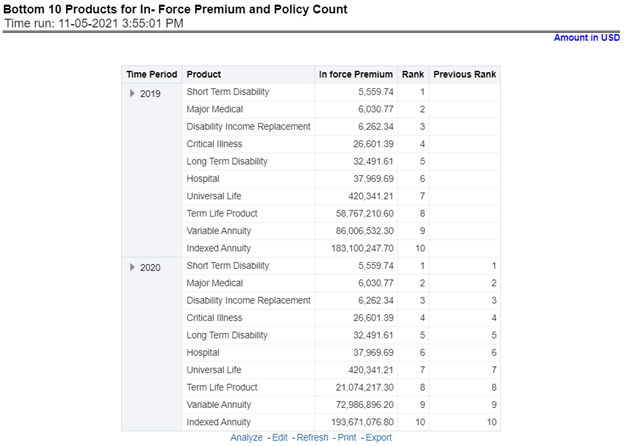
Bottom 10 Products for In-force Premium and Policy Count

This report provides ranking for the Bottom 10 products in terms of in-force written premium and policy count with previous period ranking.

Figure 6-49 Bottom 10 Products for In-force Premium and Policy Count


Bottom 10 Products for In-force Premium and Policy Count

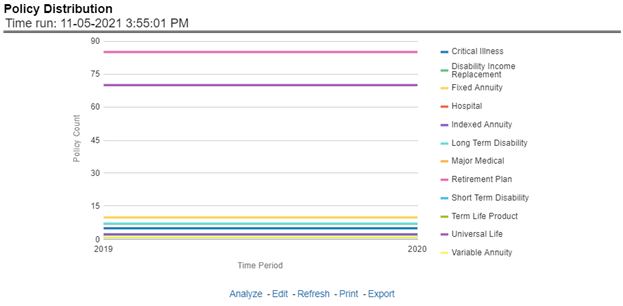
Policy Distribution

This report provides a policy count of all active policies through a time series.

Figure 6-50 Policy Distribution


Policy Distribution

New Business Policy Distribution

This report provides Policy Count or Written Premium for all new business policies (as selected from the report level view option) during the reporting period across products through time series.

Figure 6-51 New Business Policy Distribution
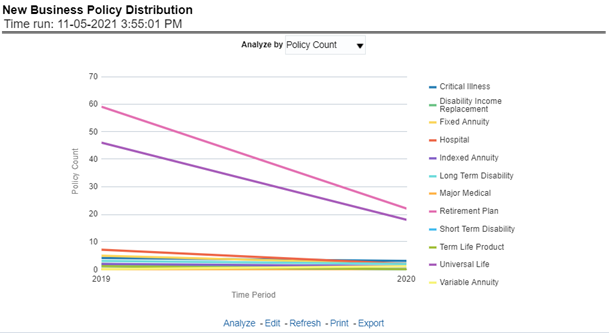

New Business Policy Distribution

Policy Attrition

The objective of the report is to show the Attrition Policy Count and Attrition Written Premium across products over a period. The Attrition Policy count (lost) and attrition written premium (lost business) values can be filtered and analyzed through report level filters on various attrition types, that is, Cancellation, nonrenewal, and expiration.

Figure 6-52 Policy Attrition


Policy Attrition

Quote Declines

The objective of the report is to show the count of quote declines across products. This report displays declines by various quote types; through a time series. The report can be analyzed by all declined quotes as well as by various quote types:

  • New Business Quotes
  • Endorsement Quotes
  • Renewal Quotes
  • Reinstatement Quotes
  • Cancellation Quotes

Figure 6-53 Quote Declines


Quote Declines

Top Policy Attrition Reasons

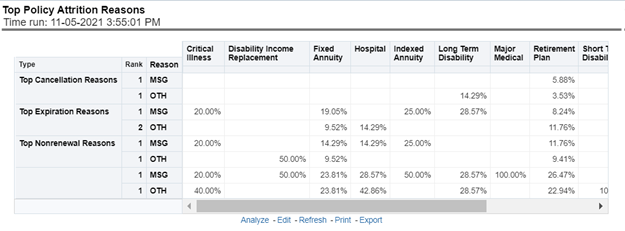
The objective of the report is to show the top three attrition reasons for each attrition type, that is, Cancellation, Non-renewal, and Expiration in terms of percentage contribution to total attrition products. These are reported for all products and lines of businesses in which the insurer writes business.

Figure 6-54 Top Policy Attrition Reasons

Top Policy Attrition Reasons

Claim Ratio Trend by Product

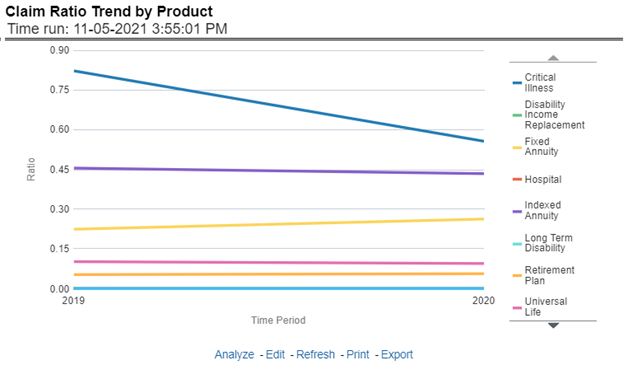
This Report shows the Claim Ratio Trend across all or selected lines of businesses and Products through a time series trend graph.

Figure 6-55 Claim Ratio Trend by Product

Claim Ratio Trend by Product

Claim Counts Trend by Product

This report displays the count of claims through a time series for all products and lines of businesses selected.

Figure 6-56 Claim Counts Trend by Product


Claim Counts Trend by Product