6.1.6 Product Performance Tab

The Product performance tab includes reports that focus on the Performance of each product under each Line of business. The filters for this tab allow the report results to be focused on selected products for comparison and targeted analysis.

The filters include:

  • Time
  • Company
  • Lines of Business
  • Products
  • Region

The various reports available under this tab are discussed in the following sections.

Product Profit and Loss

This tabular report provides a view of financial profitability by all or a specific product for or specific lines of business selected for the period. The financial performance window displays net income through premium, expenses through claims, and benefits paid with overall profitability. This report also shows the previous period figures along with a variance between the current and the previous period.

Figure 6-57 Product Profit and Loss


Product Profit and Loss

Claim Settlement Ratio

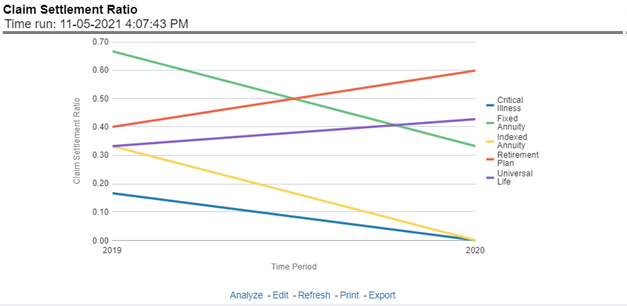
This Report shows the claim settlement ratio for all selected lines of business and Products for all or selected regions through a time series line graph. The purpose of this report is to analyze efficiency in claim settlement. The report can be viewed over various periods selected from the page level prompt.

Figure 6-58 Claim Settlement Ratio


Claim Settlement Ratio

Operating Ratio

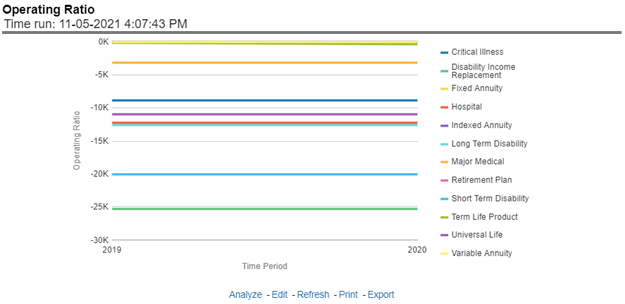
This report shows the operating ratio for all or a specific product for or specific lines of business through a time series. This report can be viewed over various periods, entities, and regions selected from page-level prompts.

Figure 6-59 Operating Ratio


Operating Ratio

Expense Ratio

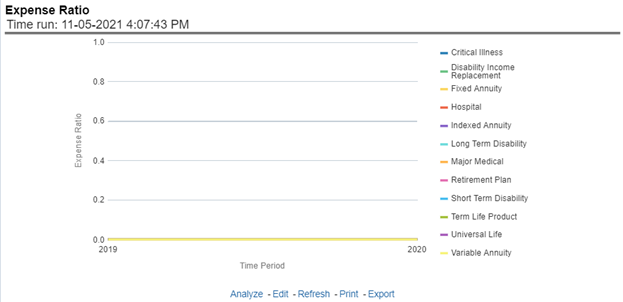
This report shows the expense ratio for all or a specific product for or specific lines of business through a time series. This report can be viewed over various periods, entities, and regions selected from page-level prompts.

Figure 6-60 Expense Ratio


Expense Ratio

Claim Ratio

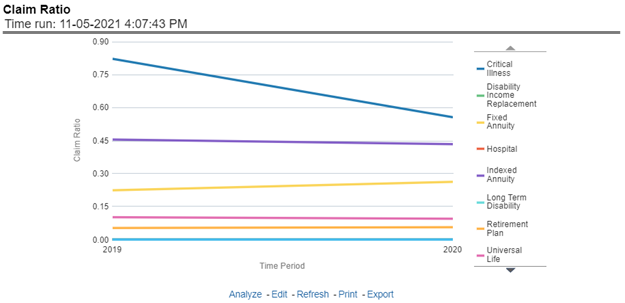
This Report shows the claim ratio for all or a specific product selected for lines of business for all or selected regions through a time series line graph. The purpose of this report is to analyze claims profitability and efficiency at the product level. The report can be viewed over various periods selected from the page level prompt.

Figure 6-61 Claim Ratio


Claim Ratio

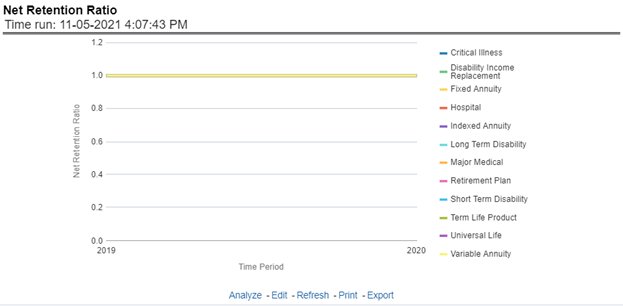
Net Retention Ratio

This report shows the net retention ratio for all or a specific product for or specific lines of business through a time series. This report can be viewed over various periods, entities, and regions selected from page-level prompts.

Figure 6-62 Net Retention Ratio


Net Retention Ratio

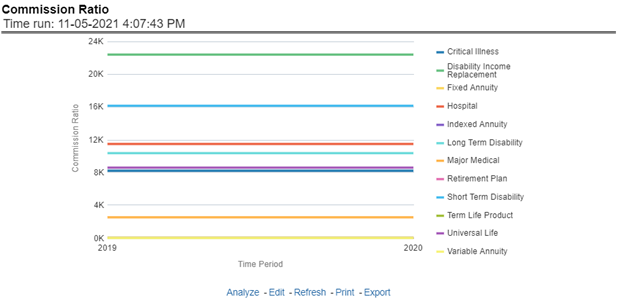
Commission Ratio

This report shows the commission ratio for all or a specific product for or specific lines of business through a time series. This report can be viewed over various periods, entities, and regions selected from page-level prompts.

Figure 6-63 Commission Ratio


Commission Ratio

Average Earned Premium Growth

This report shows growth in average earned premium for all or a specific product for or specific lines of business through a time series. This report can be viewed over various periods, entities, and regions selected from page-level prompts.

Figure 6-64 Average Earned Premium Growth
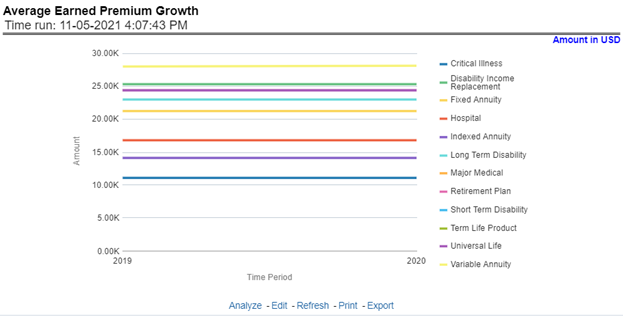

Average Earned Premium Growth

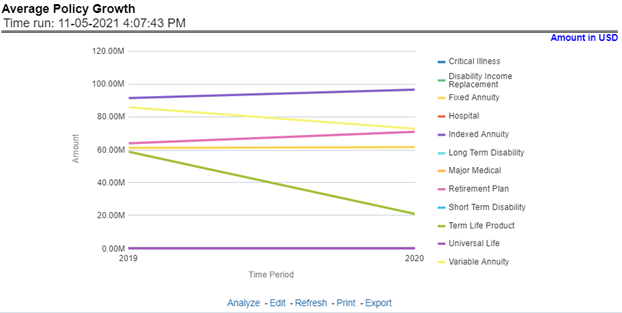
Average Policy Growth

This report shows growth in policy premium for all or a specific product for or specific lines of business through a time series. This report can be viewed over various periods, entities, and regions selected from page-level prompts.

Figure 6-65 Average Policy Growth


Average Policy Growth

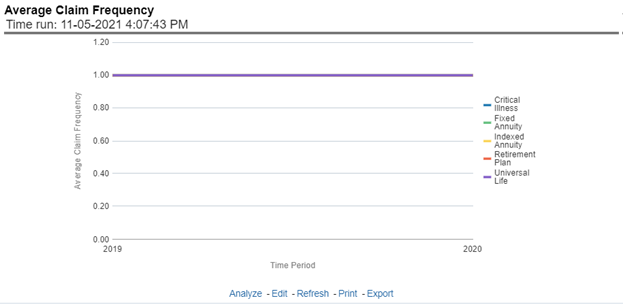
Average Claim Frequency

This report shows the average number or frequency of reported claims for all or a specific product for or specific lines of business through a time series. This report can be viewed over various periods, entities, and regions selected from page-level prompts.

Figure 6-66 Average Claim Frequency


Average Claim Frequency

Average Claim Severity

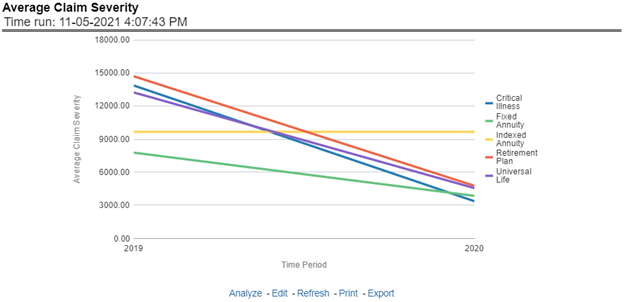
This report shows the average size or severity of reported claims for all or a specific product for or specific lines of business through a time series. This report can be viewed over various periods, entities, and regions selected from page-level prompts.

Figure 6-67 Average Claim Severity


Average Claim Severity

Top 10 Product Attrition

This report ranks the top ten products in terms of various key attrition measures like loss policy count, lost written premium, and corresponding attrition ratio.

Figure 6-68 Top 10 Product Attrition


Top 10 Product Attrition

Top 10 Claim Paying Products

This report ranks the top ten products in terms of claim payments, Claims Paid, and Incurred.

Figure 6-69 Top 10 Claim Paying Products


Top 10 Claim Paying Products