5.4.1 Summary Tab

The Summary tab includes information at the corporate level. The information contained in the reports generated summarizes how the entire organization is performing.

The filters for this tab include:

  • Time
  • Company
  • Catastrophe
  • Geography

The various reports available for this tab are discussed in the following sections.

Key Claim Performance Indicators Flash

This report shows snapshots of key performance indicators represented through flash boxes for the current period.

Figure 5-179 Key Claim Performance Indicators Flash


Key Claim Performance Indicators Flash

Claim Expenses Ratio

Claim Expense is a line graph that displays the Claim Expense Ratio, the ratio of the amount of expenses to the total amount of the claim paid, at the point in time of the reporting period and over a time series. Each insurance company is represented by its own line.

Figure 5-180 Claim Expenses Ratio


Claim Expenses Ratio

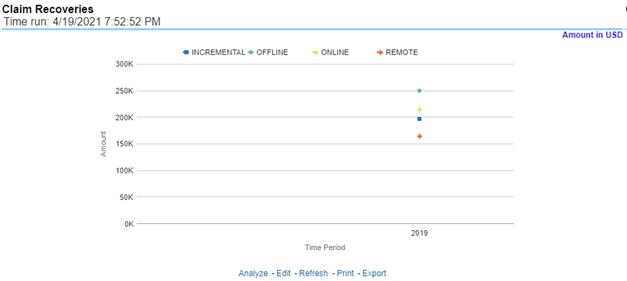
Claim Recoveries

This is a line graph that displays the monetary amount of claim recovery payments received by a company at the point in time of the reporting period and over a time series. Each insurance company is represented by its own line.

Figure 5-181 Claim Recoveries


Claim Recoveries

Claim Net Losses Map

Claim Net Losses Map is a geographic heat map that illustrates the monetary amount of Net Losses, that is, paid Losses exclusive of Expenses, over geographic regions with areas of similar amounts colored similarly. The Location of Loss provides the basis for geographical mapping.

Figure 5-182 Claim Net Losses Map


Claim Net Losses Map

Claim Count Map

This is a geographic heat map that illustrates the count of claim occurrences over geographic regions with areas of similar amounts colored similarly. The Location of Loss provides the basis for geographical mapping.

Figure 5-183 Claim Count Map


Claim Count Map

Top Ten Geographical Regions for Claim Payments

This is a table that ranks the geographical regions with the highest monetary amount total claim payments for a given reporting period. The percentage of all payments represents the amount of all claim payments generated during the same reporting period in comparison to those only for the given region.

Figure 5-184 Top Ten Geographical Regions for Claim Payments


Top Ten Geographical Regions for Claim Payments

Top Ten Geographical Regions for Claims Reported

This is a table that ranks the geographical regions with the highest claim counts for a given reporting period. The percentage of all occurrences represents the amount of all claim counts generated during the same reporting period in comparison to those only for the given region.

Figure 5-185 Top Ten Geographical Regions for Claims Reported


Top Ten Geographical Regions for Claims Reported

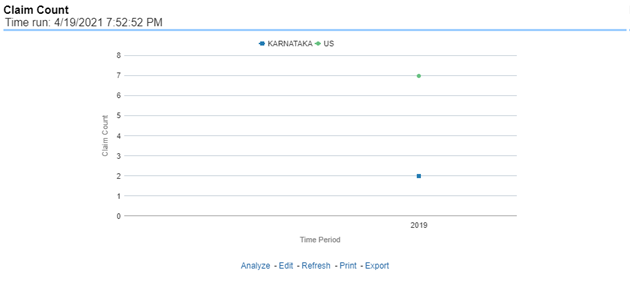
Claim Count

This report is a line graph that illustrates the count of claims added to the system over a time series and has a line for each Line of business.

Figure 5-186 Claim Count


Claim Count

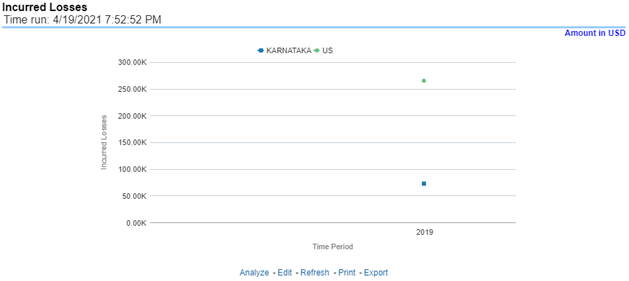
Incurred Losses

This represents the incurred losses, the total amount of paid claims, and loss reserves associated with a reporting period over a time series. This report is generated for the corporation as a whole and illustrates each Line of business with its own line.

Figure 5-187 Incurred Losses


Incurred Losses

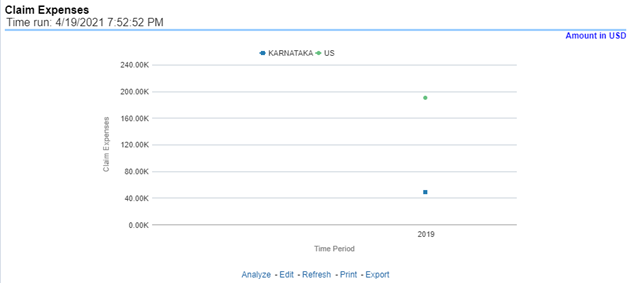
Claim Expenses

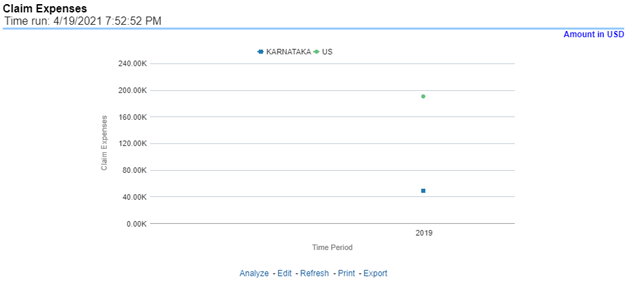
This report is a line graph that illustrates the monetary amount of claim expenses, payments made for services, and other non-loss-related costs, issued over a time series. Each insurance company is represented by its own line.

Figure 5-188 Claim Expenses


Claim Expenses

Loss Reserve on Open Claims

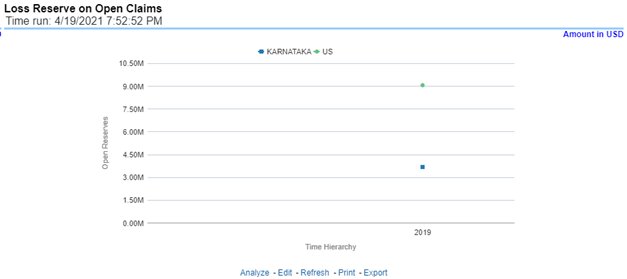
This is a line graph that displays the monetary amount in claim reserves at the point in time of the reporting period and over a time series. Each insurance company is represented by its own line.

Figure 5-189 Loss Reserve on Open Claims

Loss Reserve on Open Claims

Combined Ratio

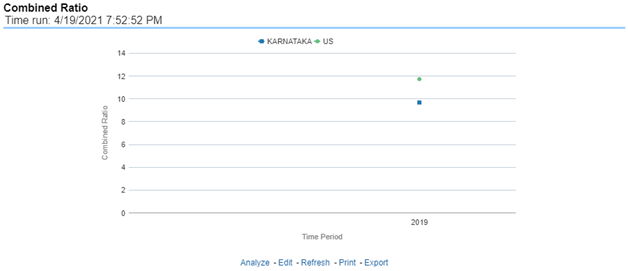
This report is a line graph that illustrates the Combined Ratio, that is, the sum of two ratios, one calculated by dividing incurred losses plus loss adjustment expense (LAE) by earned premiums, and the other calculated by dividing all other expenses by either earned premiums, over time. Each Insurance Company is represented by its own line.

Figure 5-190 Combined Ratio


Combined Ratio

Loss Ratio

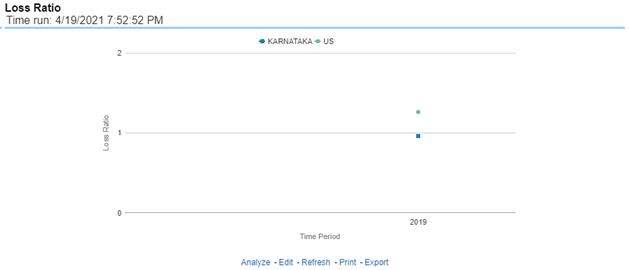
This report is a line graph that illustrates the Loss Ratio, the ratio of incurred losses to earned premiums, over a time series. In this report, each insurance company is represented by its own line.

Figure 5-191 Loss Ratio


Loss Ratio

Claims Closed without Payment

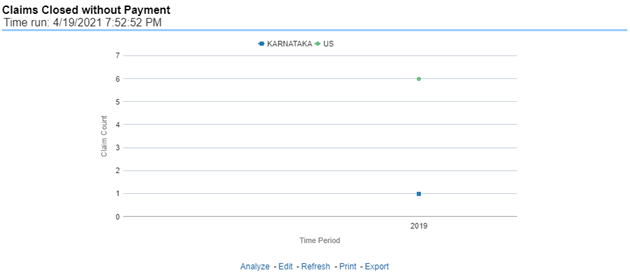
This report is a line graph that illustrates the count of claims that were closed during the reporting period without any loss payments generated for the claim.

Expenses may have been paid for these claims. Each insurance company is represented by its own line.

Figure 5-192 Claims Closed without Payment

Claims Closed without Payment

Referrals for Specialized Claim Handling
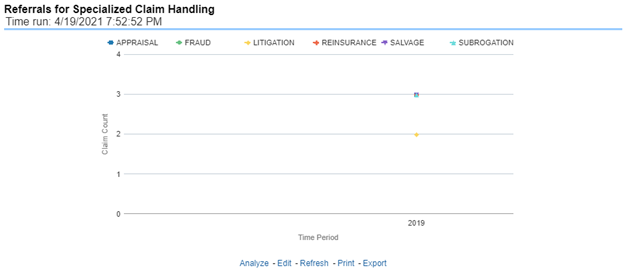
This report is a line graph that illustrates the count of claims that were referred for specialized handling during a reporting period and are shown over a time series. Each referral reason is represented by its own line.

Figure 5-193 Referrals for Specialized Claim Handling


Referrals for Specialized Claim Handling

Specialized Claim Handling Recoveries

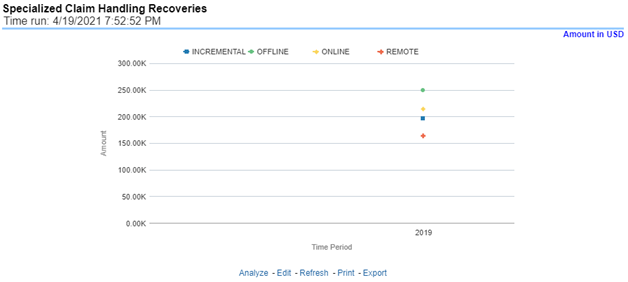
This report is a line graph that illustrates Claim Recovery Payments. Claim Recovery Payments is the monetary amount of payments received to reimburse the insurance company for payments it generated for losses and claims that were handled in a specialized manner. These manners include fraud investigation, litigation, subrogation, and so on. Each specialized claim handling method is represented by its own line and amounts are shown over a time series.

Figure 5-194 Specialized Claim Handling Recoveries

Specialized Claim Handling Recoveries