5.4.2 Claim Handling Tab

The Claim Handling tab includes information at the corporate level and focuses on the manner and quality by which the handling of a claim is measured.

The filters for this tab include:

  • Time
  • Company
  • Geography

The various reports available for this tab are discussed in the following sections.

Average Days until Closed

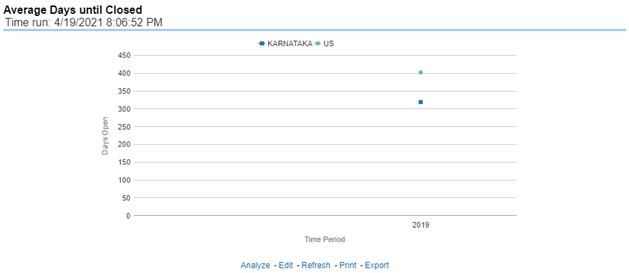
This report is a line graph that illustrates the average number of days between the day a claim is opened in the system and the date that the status of the same claim is changed to "Closed". This average is shown over a time series for each insurance company.

Figure 5-195 Average Days until Closed

Average Days until Closed

Closed Without Payment

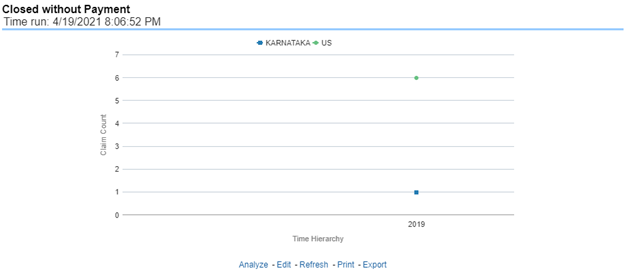
This report is a line graph that illustrates the count of claims that were closed during the reporting period without any loss payments generated for the claim.

Expenses may have been paid for these claims. Each Insurance Company is represented by its own line.

Figure 5-196 Closed Without Payment


Closed Without Payment

Claims Closed Due to Fraud

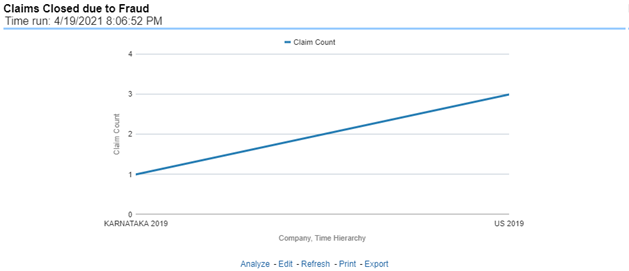
This report is a line graph that illustrates the count of claims that, after an investigation, were deemed to be fraudulent. In this report, the count is exhibited over a time series with each insurance company represented by its own line.

Figure 5-197 Claims Closed Due to Fraud

Claims Closed Due to Fraud

Reopened Claims

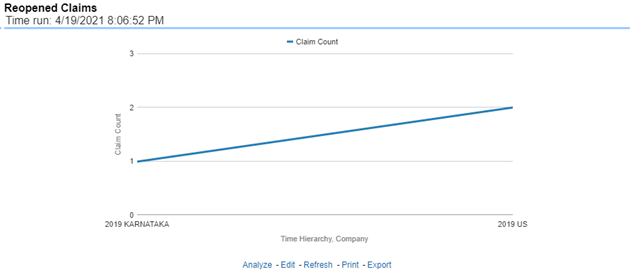
This report is a line graph that illustrates the count of claims that were changed back to an "Opened" status after it was previously closed. This report shows affected claims during the reporting periods over a time series with each insurance company represented with its own line.

Figure 5-198 Reopened Claims


Reopened Claims

Litigation Claims

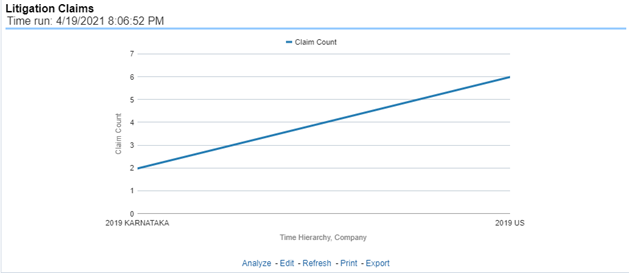
This report is a line graph that displays the count of claims that resulted in a judicial litigation case being initiated. This shows the count of claims per Line of business where this process occurred over time.

Figure 5-199 Litigation Claims


Litigation Claims

Subrogation Claims

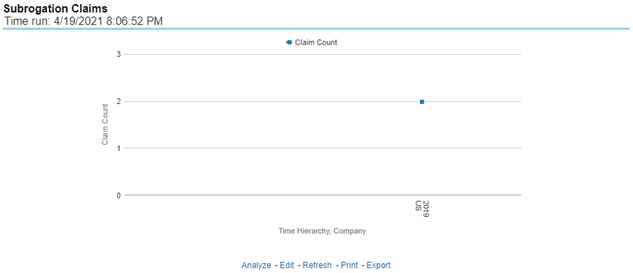
This report is a line graph that represents the count of claims where subrogation, a process by which a payment arrangement has been agreed where a non-insured at-fault party agrees to reimburse the insurer for payments it made for damages an insured suffered due to the actions of the at-fault party, was initiated for the claim during the reporting period. This report illustrates the count of the affected claims over a time series with each insurance company being represented by its own line.

Figure 5-200 Subrogation Claims


Subrogation Claims