The Lines of business tab includes reports that focus on the Key Performance
Indicators for each Line of business. The filters for this tab allow the report results to
be focused on selected lines of business for comparison and targeted analysis.
The filters include:
- Time
- Company
- Geography
- Lines of Business
The various reports available under this tab are detailed in the following sections.
Key Lines of Business Performance Indicators Flash
This report shows snapshots of current key performance areas against the target.
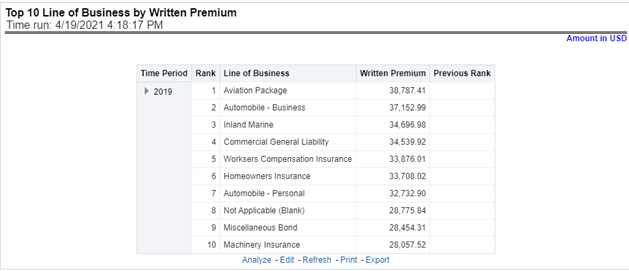
Top 10 Lines of business by Written Premium
This report ranks the top ten lines of business in terms of written premium and their
previous ranking. This report can be viewed over various periods, company,
geography, and lines of business selected from page-level prompts.
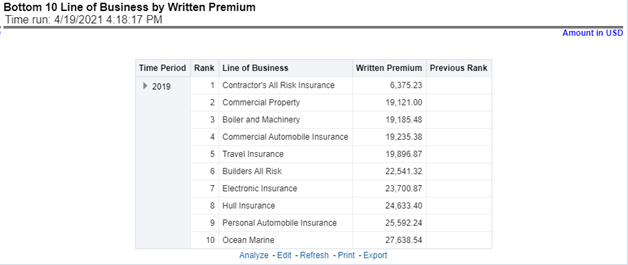
Bottom 10 Lines of business by Written Premium
This report ranks the lowest-performing bottom ten lines of business in terms of
written premium and their previous ranking. This report can be viewed over various
periods, company, geography, and lines of business selected from page-level
prompts.
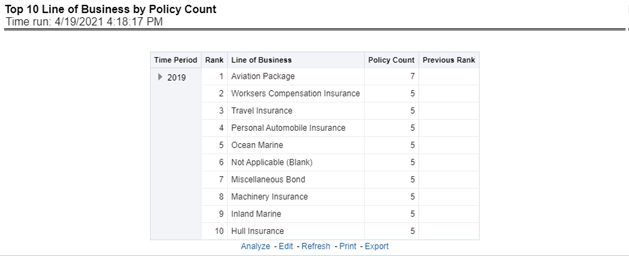
Top 10 Lines of Business by Policy Count
This report ranks the best performing top ten lines of business in terms of policy
counts and their previous ranking. This report can be viewed over various periods,
company, geography, and lines of business selected from page-level prompts.
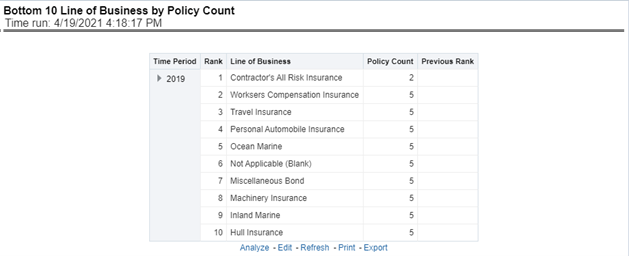
Bottom 10 Lines of Business by Policy Count
This report ranks the lowest-performing bottom ten lines of business in terms of
policy counts and their previous ranking. This report can be viewed over various
periods, company, geography, and lines of business selected from page-level
prompts.
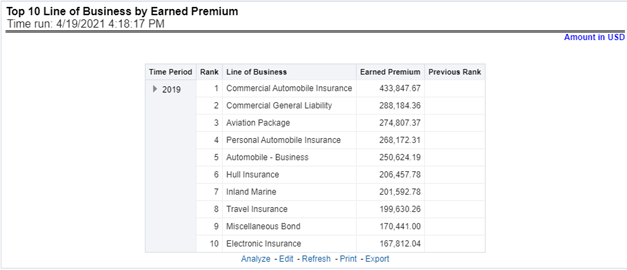
Top 10 Lines of Business by Earned Premium
This report ranks best performing top ten lines of business in terms of earned
premium and their previous ranking. This report can be viewed over various periods,
company, geography, and lines of business selected from page-level prompts.
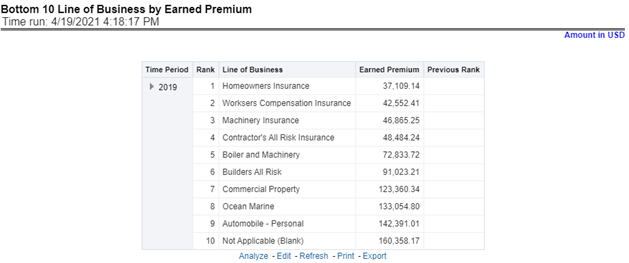
Bottom 10 Lines of Business by Earned Premium
This report ranks the lowest-performing bottom ten lines of business in terms of
earned premium and their previous ranking. This report can be viewed over various
periods, company, geography, and lines of business selected from page-level
prompts.
Claim Payment Analysis by Lines of Business
This report shows claim payments by lines of business through a comparison between
actual and planned values. This report can be viewed over various periods, company,
geography, and lines of business selected from page-level prompts. The pie chart
shows policy count by current in-time values whereas the line graph represents the
values through a time series.
Loss Expense Analysis by Lines of Business
This report shows loss expenses by lines of business through a comparison between
actual and planned values. This report can be viewed over various periods, company,
geography, and lines of business selected from page-level prompts. The pie chart
shows policy count by current in-time values whereas the line graph represents the
values through a time series.
Loss Recovery Analysis by Lines of Business
This report shows loss recovery by lines of business through a comparison between
actual and planned values. This report can be viewed over various periods, company,
geography, and lines of business selected from page-level prompts. The pie chart
shows policy count by current in-time values whereas the line graph represents the
values through a time series.
Policy Attrition by Lines of Business
This report shows policy attritions by lines of business. This report can be viewed
for current performance by different attrition types such as cancellation, expiry,
and non-renewals. This report can also be analyzed both in terms of lost policy
counts and lost written premium. This report can be viewed over various periods,
company, geography, and lines of business selected from page-level prompts. The pie
chart shows policy counts by current in-time values wherein the line graph
represents the values through a time series.
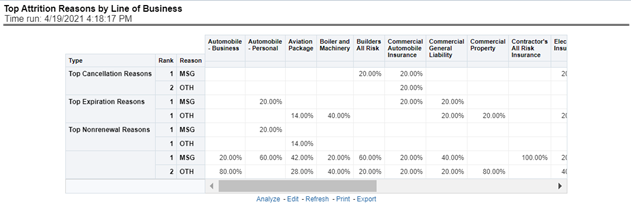
Top Attrition Reasons by Lines of Business
This report analyzes policy attrition reasons and ranks them by each attrition reason
and by lines of business.
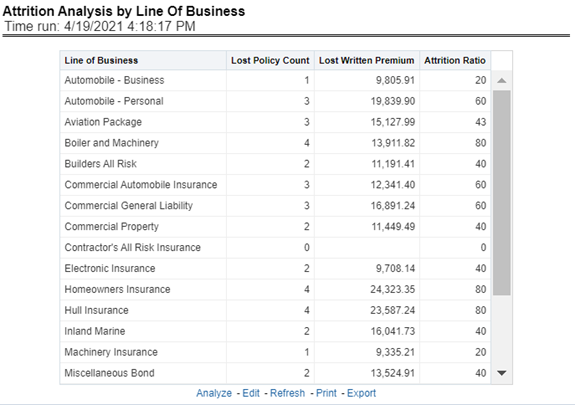
Attrition Analysis by Lines of Business
This report analyzes policy attrition reasons by lines of business and shows
attritions through the three key parameters such as lost policy count, lost premium
count, and attrition ratio.
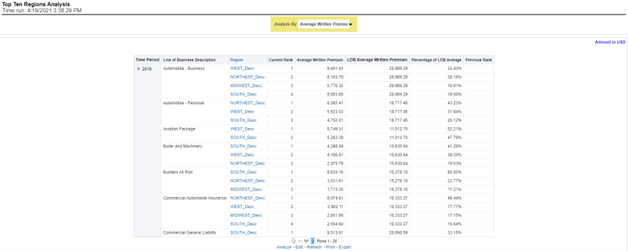
Top Ten Regions Analysis
This report analyzes policy business at a regional level and displays top-performing
Lines of business and regions. The lines of business and region-wise ranking can be
further analyzed through the following performance indicators:
- Written Premium
- Average Written Premium
- Bind Ratio
- Policy Count
- Quote Count
- Attrition Ratio
- Loss Ratio

