6.2.1 Summary Tab

The Summary tab includes information for lines of businesses at the corporate level. The information contained in the reports generated summarizes how the entire organization is performing for all the lines of businesses.

The filters include:

  • Time
  • Company
  • Lines of Business
  • Region

The various reports available under this tab are detailed in the following sections.

Key Policy Performance Indicators Flash

This report shows snapshots of key performance indicators represented through flash boxes for the current period.

Figure 6-70 Key Policy Performance Indicators Flash


Key Policy Performance Indicators Flash

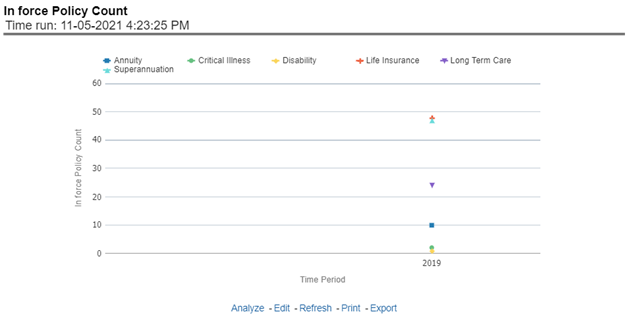
In force Policy Count

This report shows active in-force policy counts across all lines of businesses and underlying products through a time series. This report can be viewed over various periods, company, region, and lines of business selected from page-level prompts.

Figure 6-71 In force Policy Count


In force Policy Count

New Business Conversion Ratio

This report shows new business quote to conversion ratio performance across lines of business through a time series. This report can be viewed over various periods, company, region, and lines of business selected from page-level prompts.

Figure 6-72 New Business Conversion Ratio
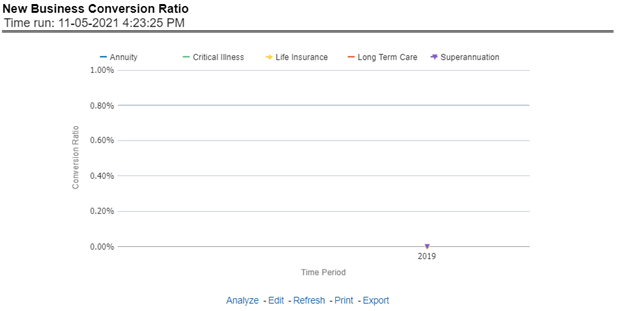

New Business Conversion Ratio

New Business Written Premium

This report shows new business performance in terms of written premium across all lines of business and underlying products through a time series. This report can be viewed over various periods, company, region, and lines of business selected from page-level prompts.

Figure 6-73 New Business Written Premium
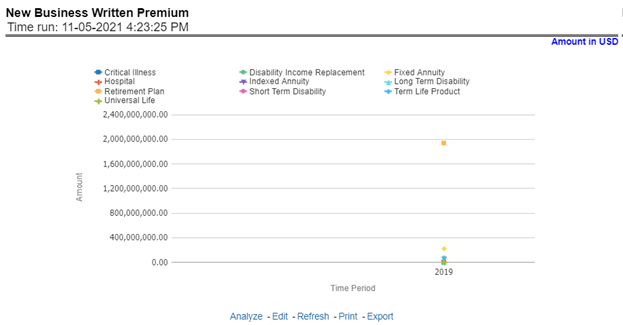

New Business Written Premium

Policy Acquisition by Distribution Channel
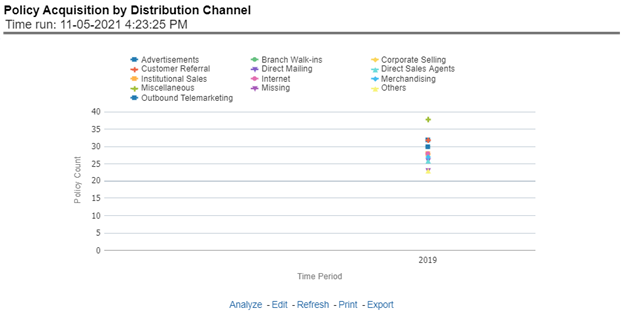
This report shows policy performance in terms of new business acquisition through different distribution channels through a time series. This report can be viewed over various periods, company, region, and lines of business selected from page-level prompts.

Figure 6-74 Policy Acquisition by Distribution Channel


Policy Acquisition by Distribution Channel

New Business Cancellation Ratio

This report shows policy performance in terms of loss of new business through cancellation over a time series. This report can be viewed over various periods, company, geography, and lines of business selected from page-level prompts.

Figure 6-75 New Business Cancellation Ratio


New Business Cancellation Ratio

Top 10 Products by New Business Policies

This report shows policy performance by ranking top selling ten products acquiring new business policies. This report shows policy counts and can be analyzed by report level filters, product name, and product category. This report can be viewed over various periods, company, region, and lines of business selected from page-level prompts.

Figure 6-76 Top 10 Products by New Business Policies


Top 10 Products by New Business Policies

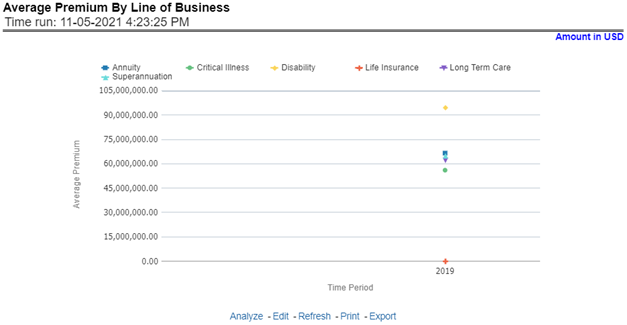
Average Premium by Lines of Business

This report shows policy performance in terms of the average premium generated by lines of business through a time series. This report can be viewed over various periods, company, region, and lines of business selected from page-level prompts.

Figure 6-77 Average Premium by Lines of Business

Average Premium by Lines of Business

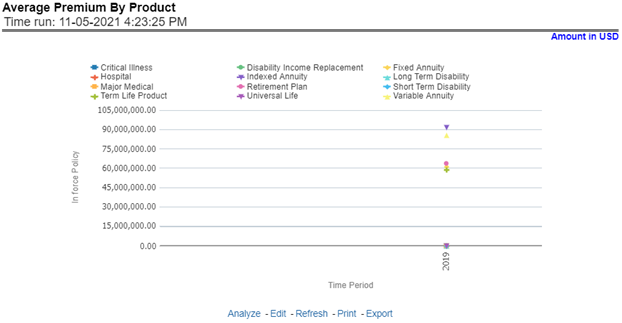
Average Premium by Product

This report shows policy performance in terms of the average premium generated by-products through a time series. This report can be viewed over various periods, company, region, and lines of business selected from page-level prompts.

Figure 6-78 Average Premium by Product

Average Premium by Product