6.2.2 Key Facts Tab

The Key Fact tab includes Key Performance Indicator Reports for lines of businesses at the group level. The filters for this tab allow the report results to be focused on selected combinations for comparison and targeted analysis.

The filters include:

  • Time
  • Company
  • Lines of Business
  • Region

The various reports available under this tab are detailed in the following sections.

Key Policy Performance Indicators

This report shows snapshots of current key performance areas against a target.

Figure 6-79 Key Policy Performance Indicators


Key Policy Performance Indicators

Policy Premium by Premium Type

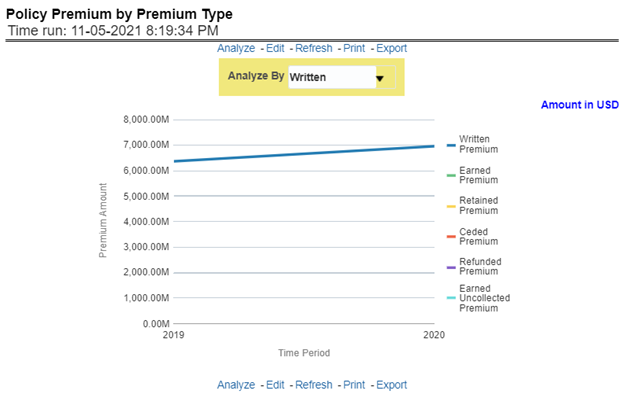
This report shows business revenue in terms of premium generated through different premium types over a time series. Various types of premium options such as written, earned, ceded, retained, earned uncollected, and refunded are available as report-level filters. This report can be viewed over various periods, company, region, and lines of business selected from page-level prompts.

Figure 6-80 Policy Premium by Premium Type

Policy Premium by Premium Type

Policy Expense Summary

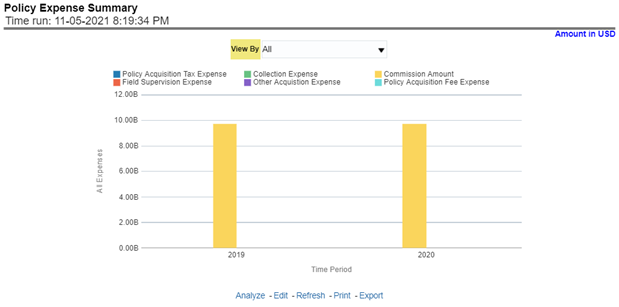
This report shows different policy-related expenses incurred over the period like acquisition exp, collection exp, and so on. The report can be analyzed by report level filters for different expense types. This report can be viewed over various periods, company, region, and lines of business selected from page-level prompts.

Figure 6-81 Policy Expense Summary


Policy Expense Summary

Policy Count by Policy Type

This report shows the count of policies through different policy types, that is, active in-force, reissue, rewritten, canceled, and non-renewed policies through a time series. This report can be viewed over various periods, company, region, and lines of business selected from page-level prompts. The pie chart shows policy count by current in-time values whereas the line graph represents the values through a time series.

Figure 6-82 Policy Count by Policy Type


Policy Count by Policy Type

Policy Acquisition by Distribution Channel

This report shows the percentage of policies acquired through different sales and distribution channels maintained by the company and can be analyzed by report level filters, policy count, and premium amount. This report can be viewed over various periods, company, region, and lines of business selected from page-level prompts.

Figure 6-83 Policy Acquisition by Distribution Channel


Policy Acquisition by Distribution Channel

Policy Attrition - Company vs. Insured

This report shows a loss of business through policy attrition through a time series. Attrition analysis can be done by percentage between company initiated and insured initiated attrition through the attrition types such as cancellation, non-renewal, and expiry, as well as attrition policy premium amount and attrition policy count. This report can be viewed over various periods, company, region, and lines of business selected from page-level prompts. The pie chart shows policy count by current in-time values whereas the line graph represents the values through a time series.

Figure 6-84 Policy Attrition - Company vs. Insured


Policy Attrition - Company vs. Insured

Policy Attrition by Reason

This report shows policy attrition occurred due to various attrition reasons. Attrition reason analysis can be done by percentage between company initiated and insured initiated attrition through the attrition types such as cancellation, non-renewal, and expiry as well by attrition reasons which can be selected from report level filter. This report can be viewed over various periods, company, region, and lines of business selected from page-level prompts. The pie chart shows policy count by current in-time values whereas the line graph represents the values through a time series.

Figure 6-85 Policy Attrition by Reason


Policy Attrition by Reason

Policy Attrition By Distribution Channel

This report shows policy attrition by various distribution channels. Attrition analysis can be done by percentage between company initiated and insured initiated attrition through the attrition types such as cancellation, non-renewal, and expiry as well by distribution channels. This report can be viewed over various periods, company, region, and lines of business selected from page-level prompts. The pie chart shows policy count by current in-time values whereas the line graph represents the values through a time series.

Figure 6-86 Policy Attrition By Distribution Channel


Policy Attrition By Distribution Channel

Policy Attrition By Billing Plan

This report shows policy attrition by various distribution channels. Attrition analysis can be done by percentage between company initiated and insured initiated attrition through the attrition types such as cancellation, non-renewal, and expiry as well by billing plan type. This report can be viewed over various periods, company, region, and lines of business selected from page-level prompts. The pie chart shows policy count by current in-time values whereas the line graph represents the values through a time series.

Figure 6-87 Policy Attrition By Billing Plan


Policy Attrition By Billing Plan

Attrition by Cancellation Timing

This report shows policy attrition by cancellation timings. Attrition analysis can be done by percentage between company initiated and insured initiated attrition through the attrition types such as cancellation, non-renewal, and expiry as well by cancellation/lapses attrition periods, for example, "First 30 days" and "First 45 days". This report can be viewed over various periods, company, region, and lines of business selected from page-level prompts. The pie chart shows policy count by current in-time values whereas the line graph represents the values through a time series.

Figure 6-88 Attrition by Cancellation Timing


Attrition by Cancellation Timing