5.2.6 Producer Performance Tab
The Producer Performance tab focuses on the results of the Producing Agents and Producing Agencies. The filters for this tab allow the report results to be focused on selected combinations for comparison or more targeted analysis.
The filters include:
- Time
- Company
- Lines of Business
- Product
- Geography
The various reports available under this tab are detailed in the following sections.
Producer Performance Ranking
This tabular report displays the top 10 and bottom 10 in performance based on the following View By options:
- Written Premium
- Average Written Premium
- Bind Ratio
- Policy Count
- Quote Count
- Attrition Ratio
- Claim Count
- Loss Ratio Excluding ULAE
- Loss Payments
The View determines whether Producing Agent or Producing Agency is illustrated in the tabular report.
Figure 5-108 Producer Performance Ranking – Top 10 and Bottom 10

Active Producer Appointments
This map plots the count of agents or agencies with active appointments to write new business. The agent or agency address is the basis for the location of the agent.
Figure 5-109 Active Producer Appointments

Producer Performance Analysis
This tabular report provides a summary of Key Performance Metrics for the agents and agencies and averages the results for each of the respective classifications. This provides the basis for comparison when looking at individual producer performances.
Figure 5-110 Producer Performance Analysis

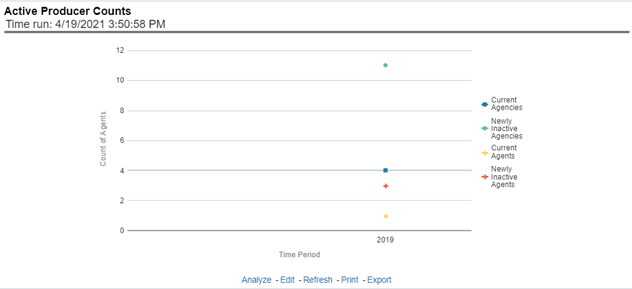
Active Producer Counts
This line graph illustrates the different segmentations of agents with active agent appointments over time. Each segment line represents the count of agents that have an active appointment to write business at that point in time.
Figure 5-111 Active Producer Counts

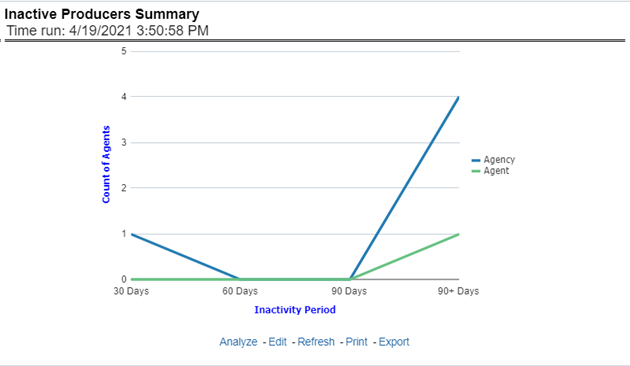
Inactive Producers Summary
This line graph illustrates the count of agents or agencies over time that have not written a new business policy within either 30, 60, or 90 days since the reporting period start date. These producers have current appointments but are not currently placing new policies with the organization.
Figure 5-112 Inactive Producers Summary

Individual Producer Performance Analysis
This tabular report illustrates the performance in key performance areas. The results are populated based on the values selected in the agency and producing agent filters. This allows multiple columns to present for multiple view selections.
Figure 5-113 Individual Producer Performance Analysis
