5.2.4 Product Tab
The Product tab includes reports that focus on the Key Performance Indicators for each Product. The filters for this tab allow the report results to be focused on selected products for comparison and targeted analysis.
The filters include:
- Time
- Company
- Product
The various reports available under this tab are detailed in the following sections.
Quote Counts by Type
This pie chart illustrates the percentages of quotes for each quote type at the reporting period. The corresponding line graph illustrates the similar value, as selected by the filter, over time with a line for each Product. The filter allows the user to select the quote type.
Figure 5-94 Quote Counts by Type

Policy Acquisition by Distribution Channel
This pie chart illustrates the percentage of policy count or written premium attributed based on the distribution channels for the corporation. The corresponding bar graph has a stacked bar for each product. Each bar is stacked by distribution channel type and is repeated over time.
Figure 5-95 Policy Acquisition by Distribution Channel

Quote Counts by Source
This pie chart illustrates the percentages of quotes for each quote source at the reporting period and can be viewed by the Quote Types. The corresponding bar graph has a stacked bar for each Line of business over time that is stacked with each quote source.
Figure 5-96 Quote Counts by Source

Quote Counts by Source Method
This pie chart shows the percentage of quotes for each quote source method at the reporting period and can be viewed by the Quote Types. The corresponding bar graph has a stacked bar for each product over time that is stacked with each quote source method.
Figure 5-97 Quote Counts by Source Method

Average Quote Conversion Days
This is a time-series graphical trend report where producers' performance is measured by average days required in converting from a quote to a policy. This acts as a performance indicator for producers' efficiency in business conversion.
Drill Down: The report can be further analyzed by Lines of business or Product-wise by clicking the Click for Graphical View button.
Figure 5-98 Average Quote Conversion Days

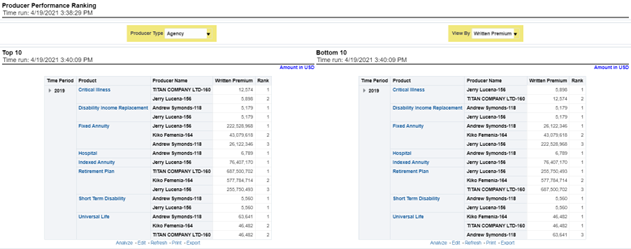
Producer Performance Ranking
This tabular report displays the top 10 and bottom 10 in performance based on the following View By options:
- Written Premium
- Average Written Premium
- Bind Ratio
- Policy Count
- Quote Count
- Attrition Ratio
- Claim Count
- Loss Ratio Excluding ULAE
- Loss Payments
The table can be populated based on the View options, Producing Agent or Producing Agency. This report shows performance based on the Product focus.
Figure 5-99 Producer Performance Ranking

Product Ranking
Figure 5-100 Product Ranking
