4.3.1 Data Visualization
In OFS Investigation Toolkit, data visualization provides insight into transactions.
- Table
- Area Chart
- Bar Chart
- Funnel Chart
- Line Chart
- Pie Chart
- Pyramid Chart
- Treemap Diagram
- Sunburst Diagram
- Tag Cloud
- Box Plot
- Scatter Plot
- Map Visualizer
- Text
Table
OFS Investigation Toolkit allows you to visualize your data in the form
of a Table Diagram. The table can be sorted by column in ascending or descending
order. Additionally, the table can be filtered for a specific search term. Rows that
do not contain this term are hidden from view and the remaining rows highlight the
location of the search term within the row.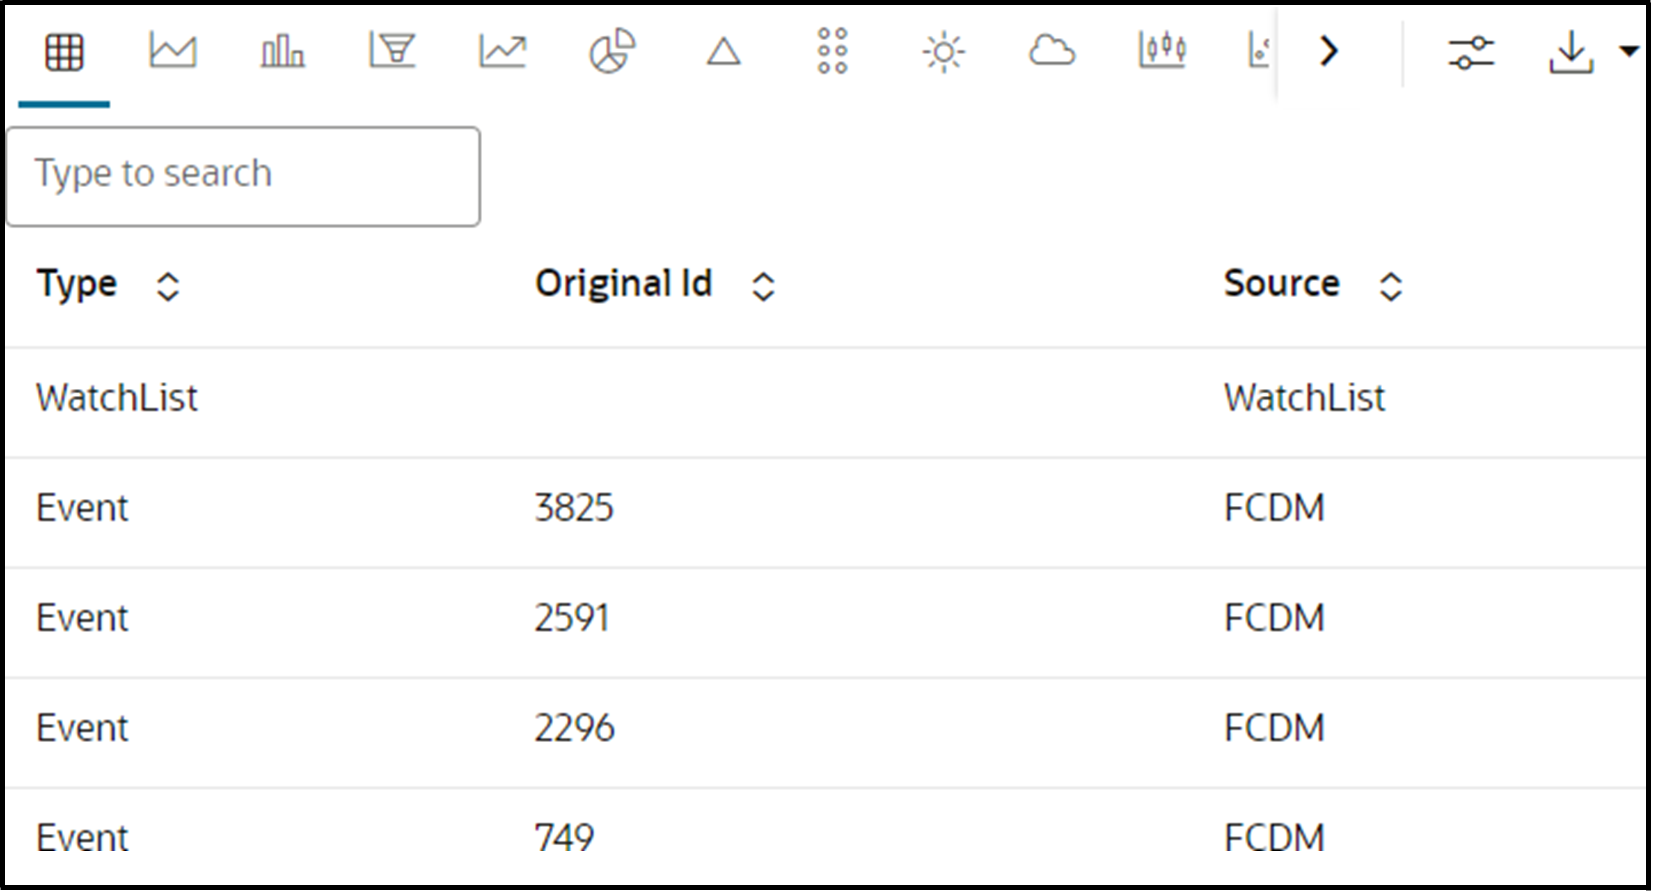
Description of the illustration table-format.png
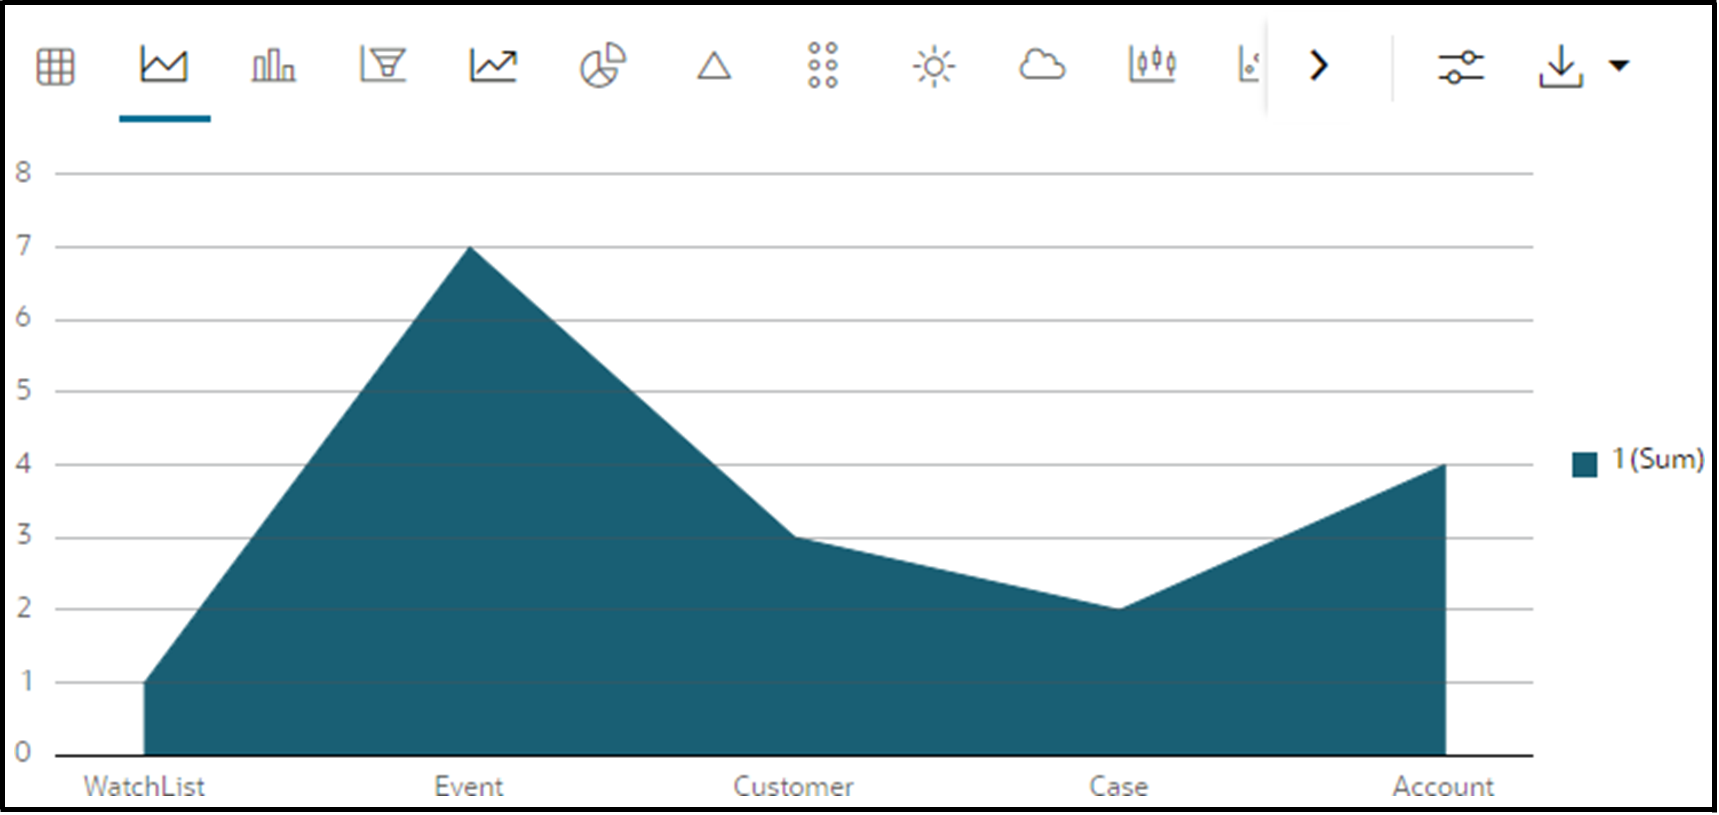
Area Chart
OFS Investigation Toolkit allows you to visualize your data in the form of an Area Chart.
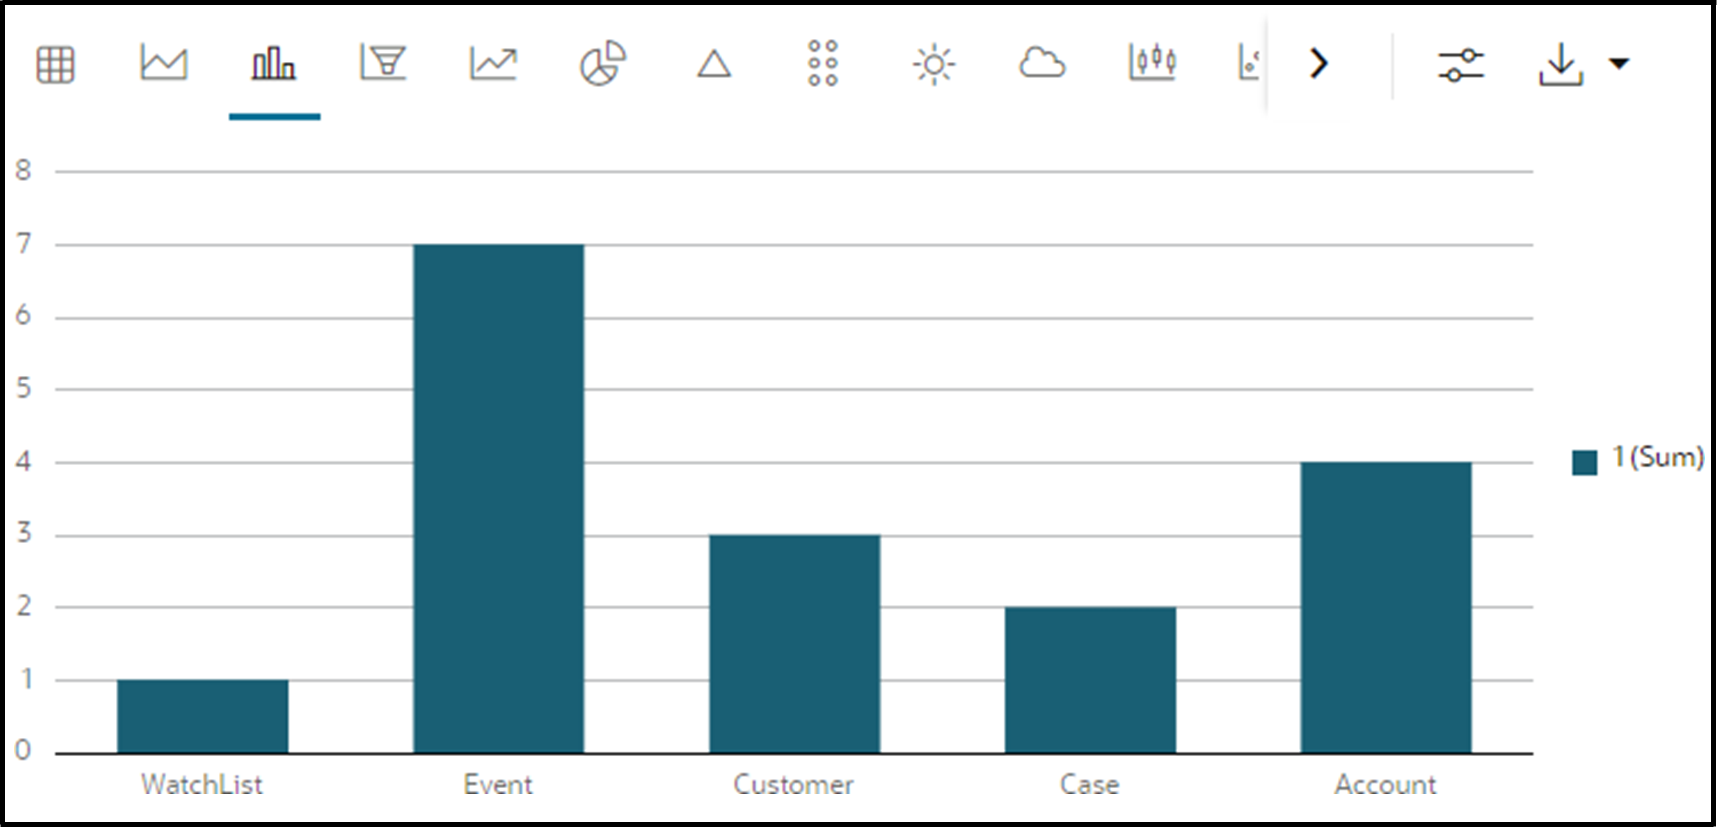
Bar Chart
OFS Investigation Toolkit allows you to visualize your data in the form of a Bar Chart.
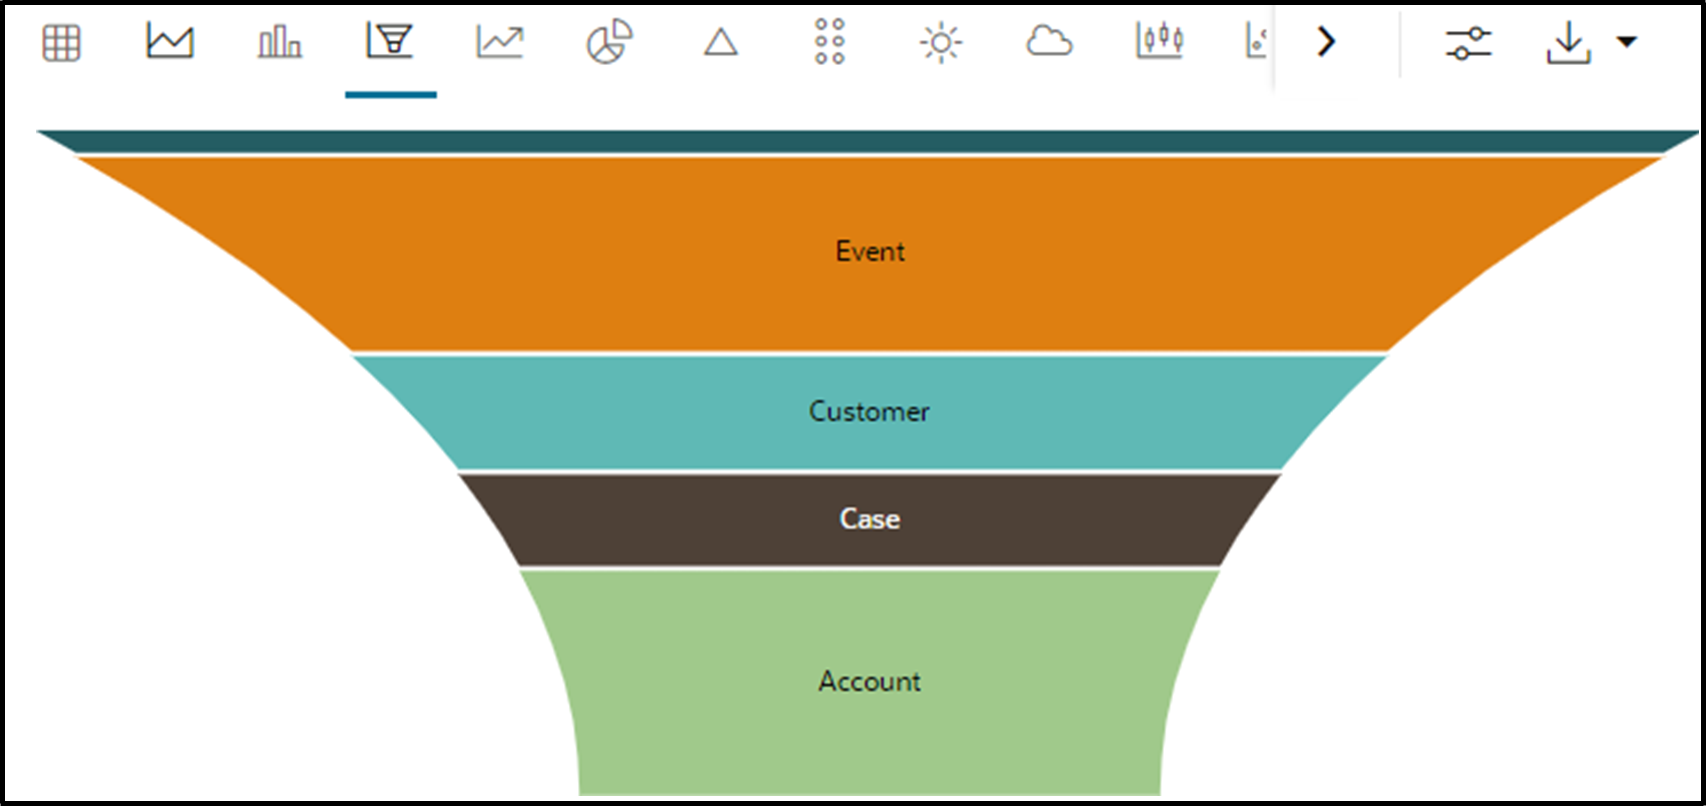
Funnel Chart
OFS Investigation Toolkit allows you to visualize your data in the form of a Funnel Chart.
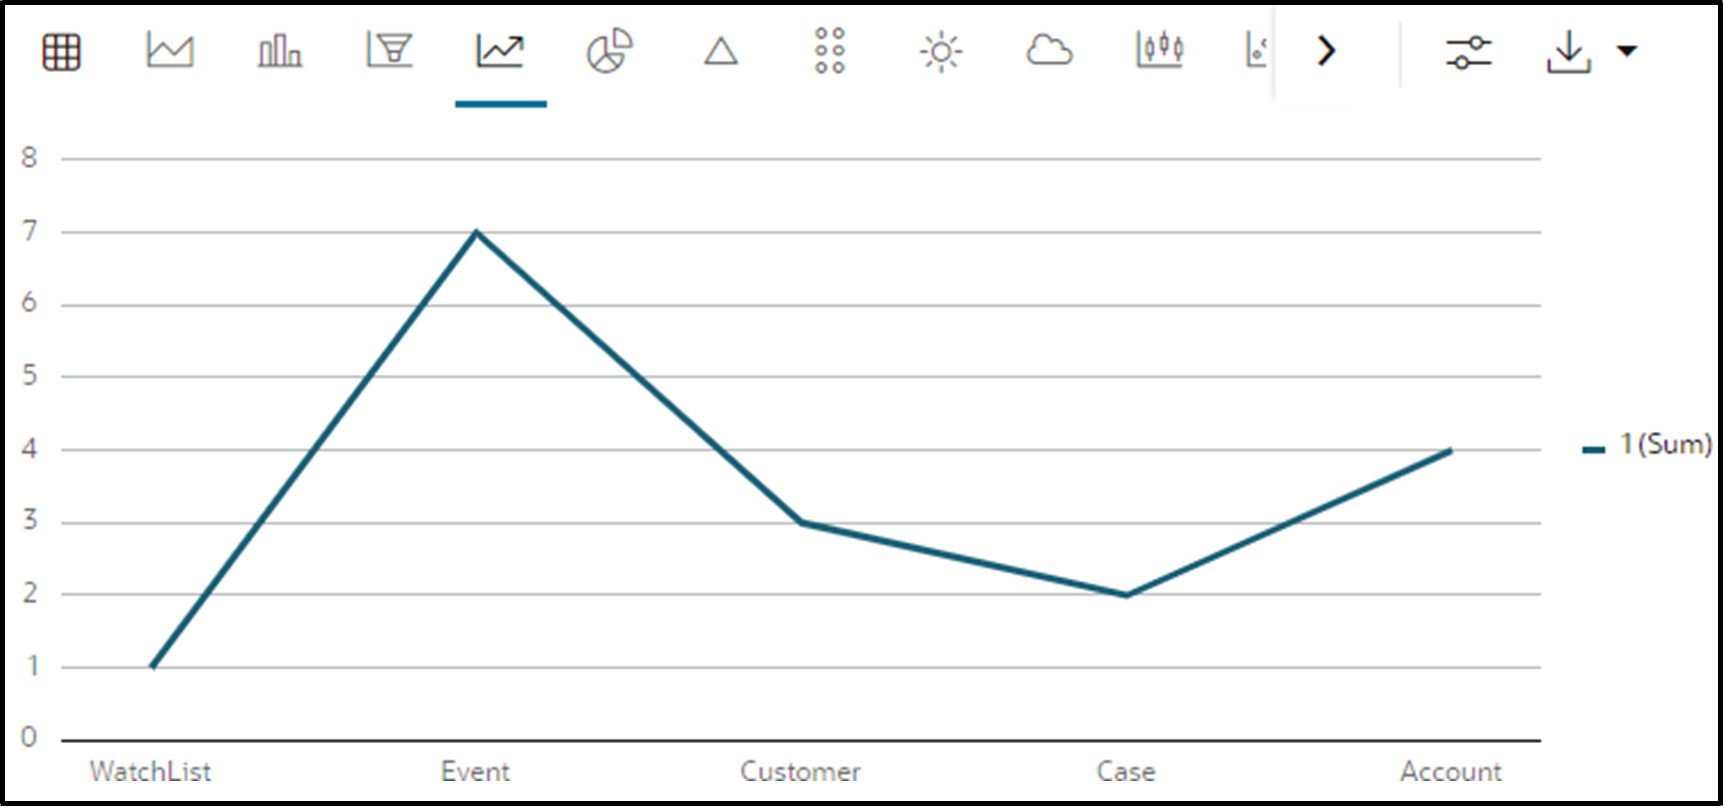
Line Chart
OFS Investigation Toolkit allows you to visualize your data in the form of a Line Chart.
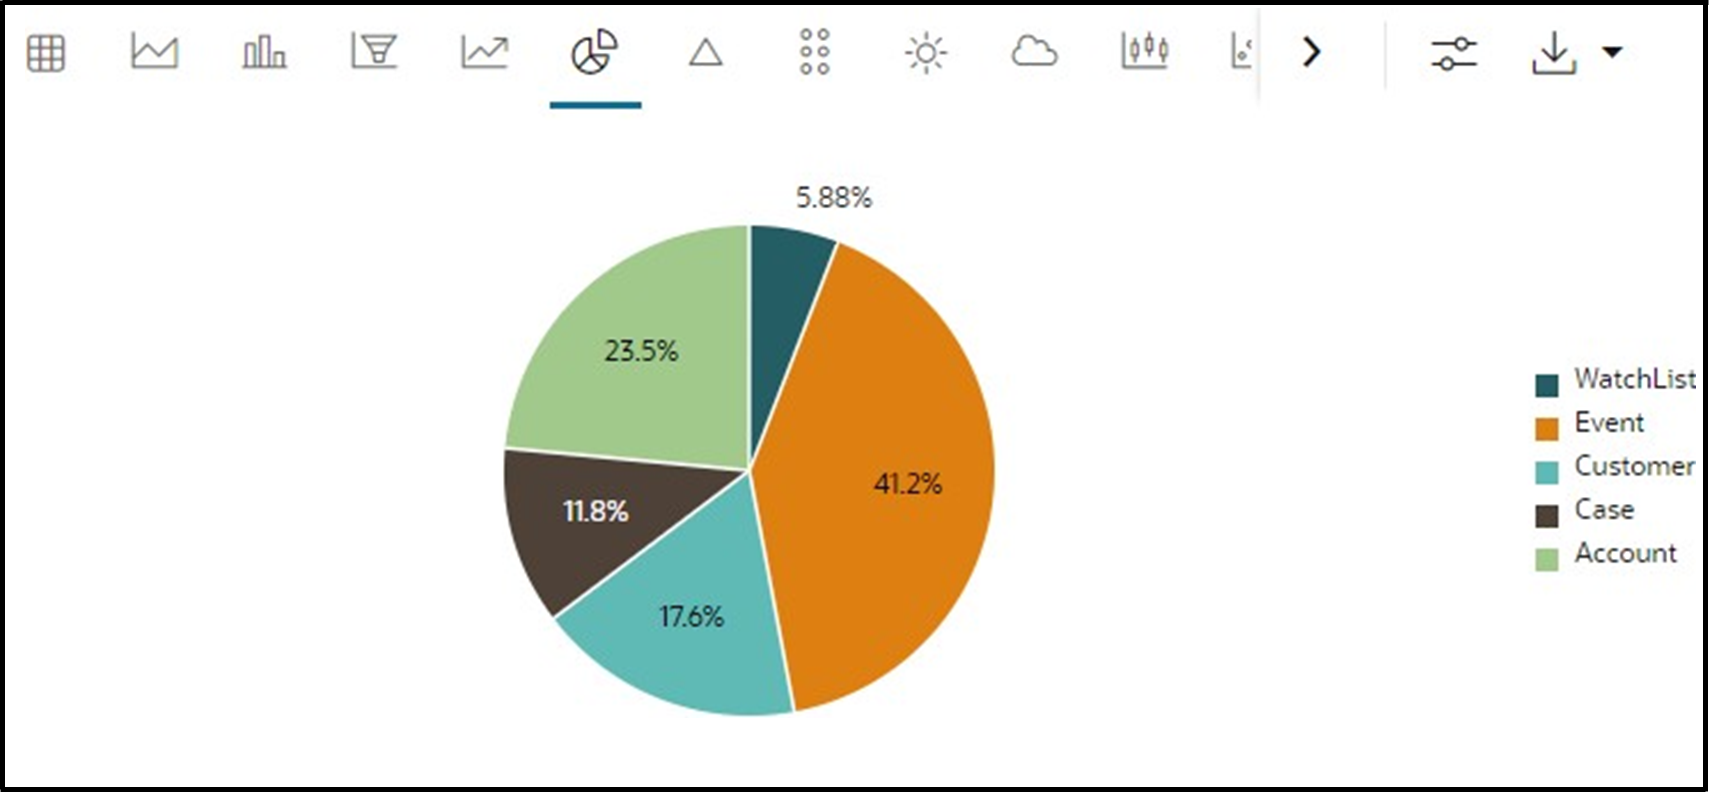
Pie Chart
OFS Investigation Toolkit allows you to visualize your data in the form of a Pie Chart.
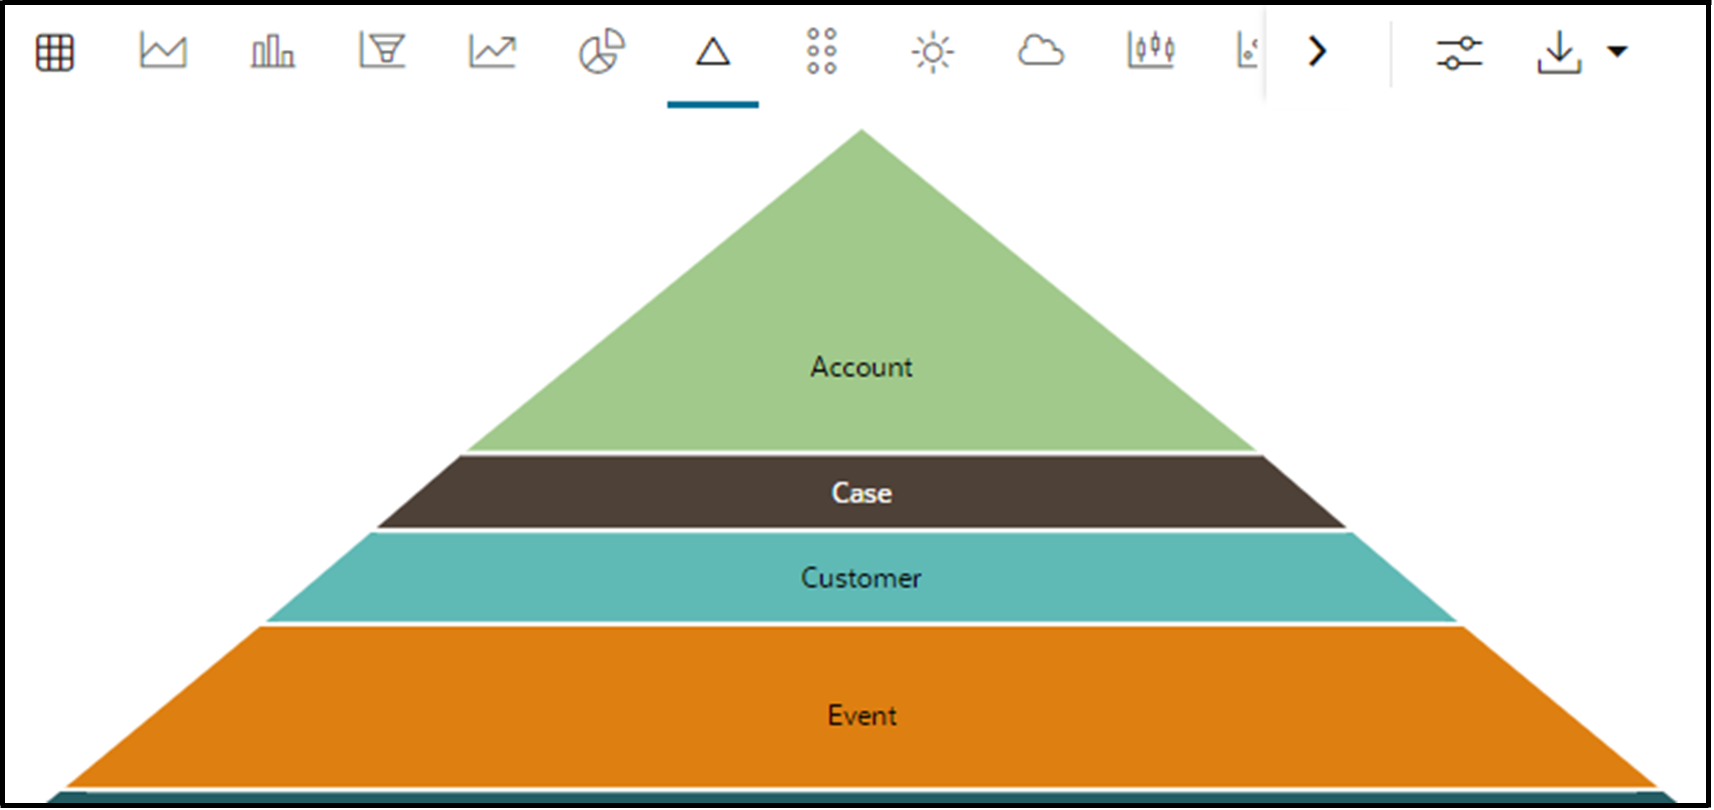
Pyramid Chart
OFS Investigation Toolkit allows you to visualize your data in the form of a Pyramid Chart.
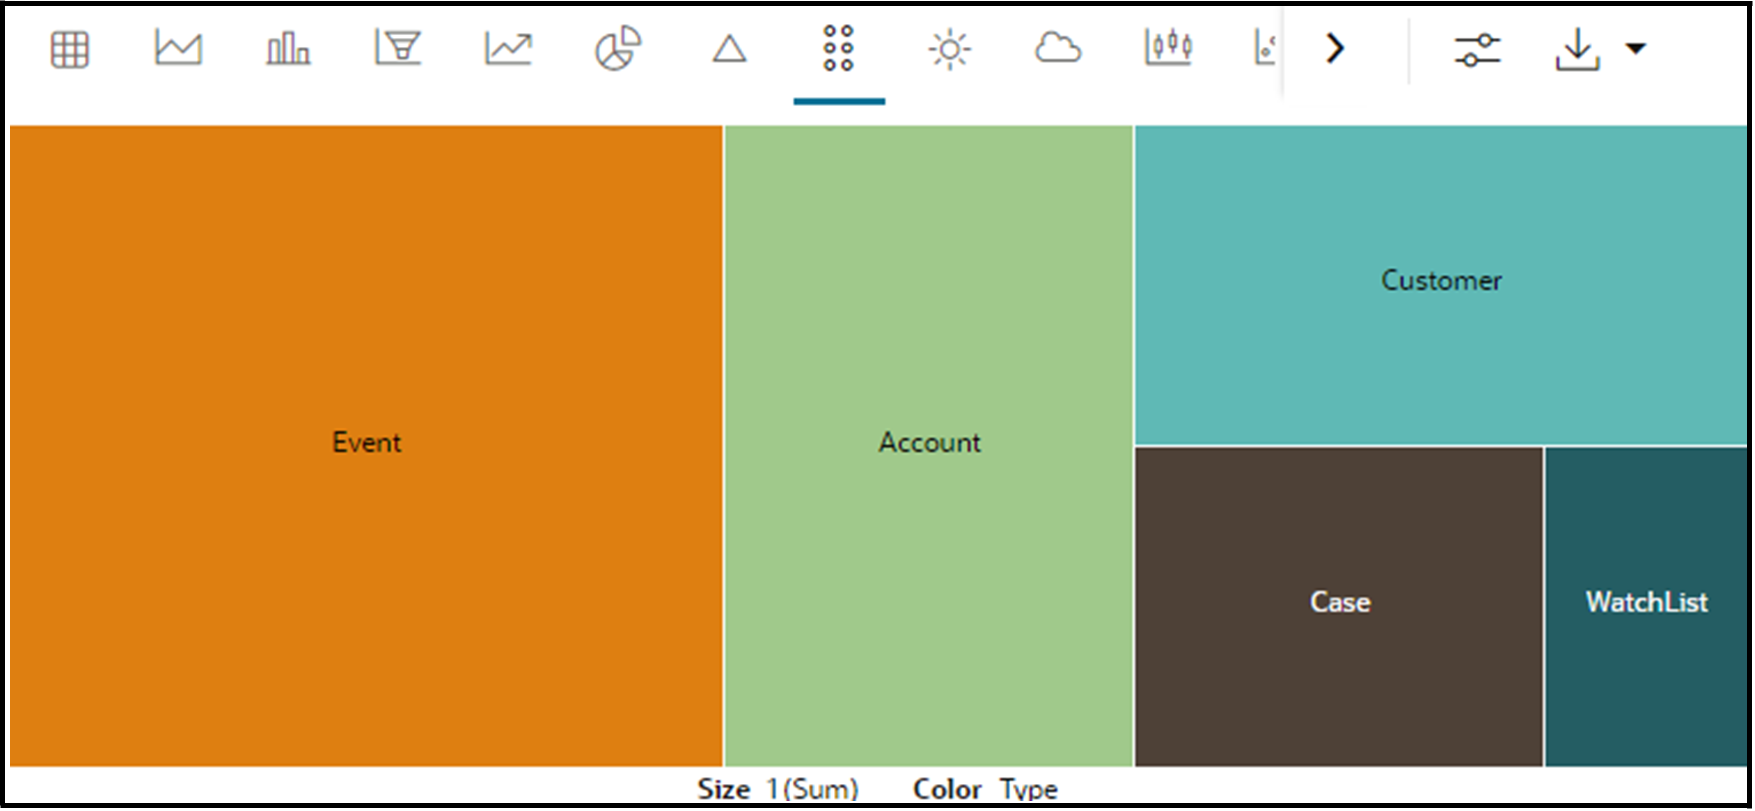
Tree Map Diagram
OFS Investigation Toolkit allows you to visualize your data in the form of a Tree Map Diagram.
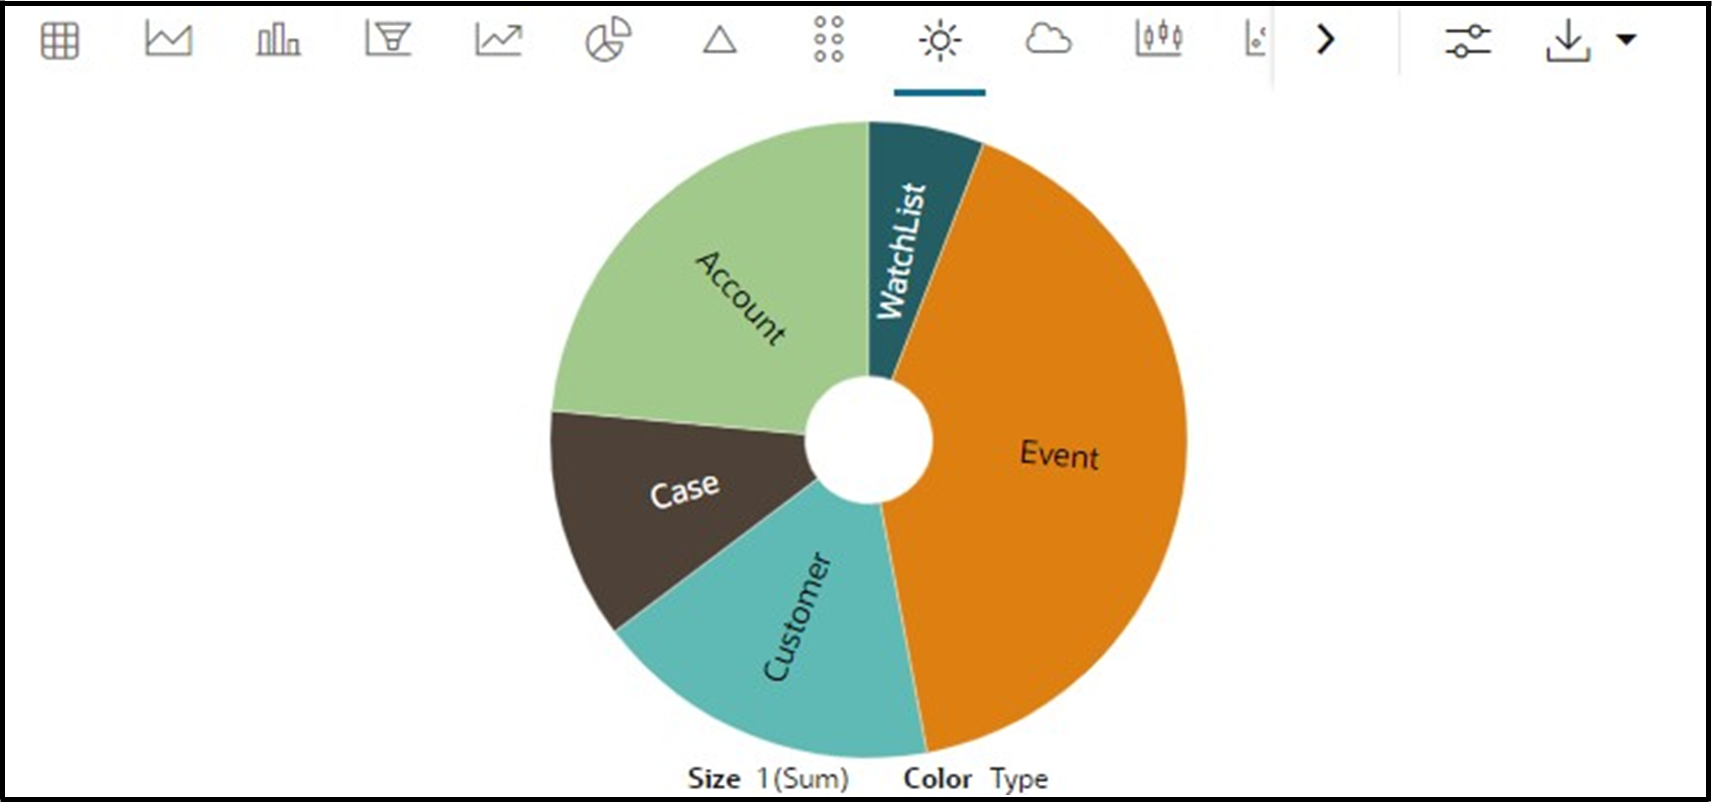
Sunburst Diagram
OFS Investigation Toolkit allows you to visualize your data in the form of a Sunburst Diagram.
Tag Cloud
OFS Investigation Toolkit allows you to visualize your data in the form of tags. The tag cloud operation is used to identify the spots where there are more flags.
Box Plot
OFS Investigation Toolkit allows you to visualize your data in the form of a Box Plot.
Scatter Plot
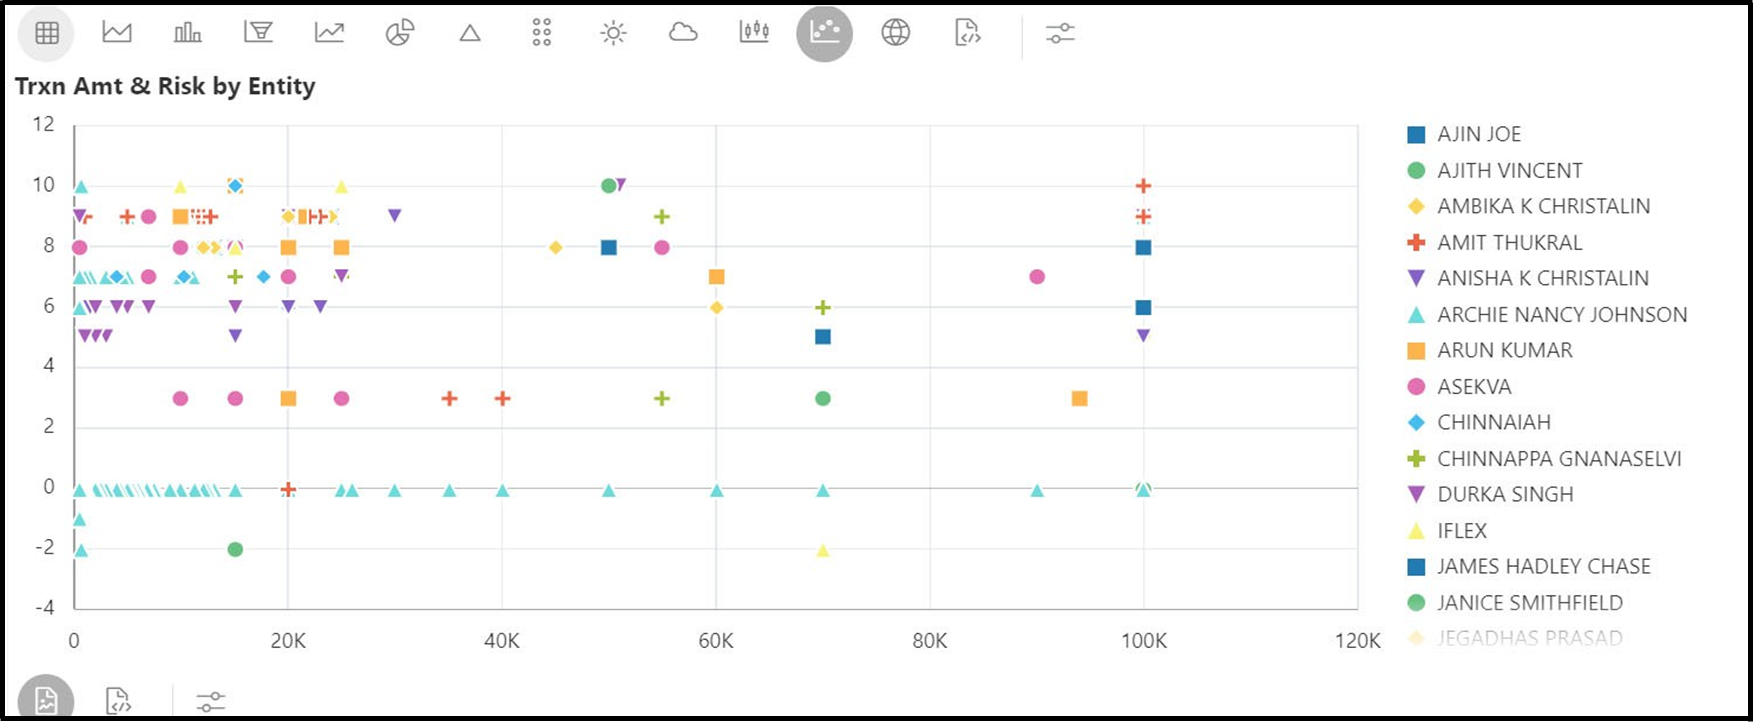
OFS Investigation Toolkit allows you to visualize your data in the form of a Scatter Plot.
Map Visualizer
OFS Investigation Toolkit allows you to visualize your data on top of a Map.
