A.1.7 View the Case Graph (and Searched Entities)
This paragraph allows you to view the network graphical representation of the case and its associated entities. This paragraph displays the case graph along with the graph for the non-case entities searched in the Input Search Results paragraph.
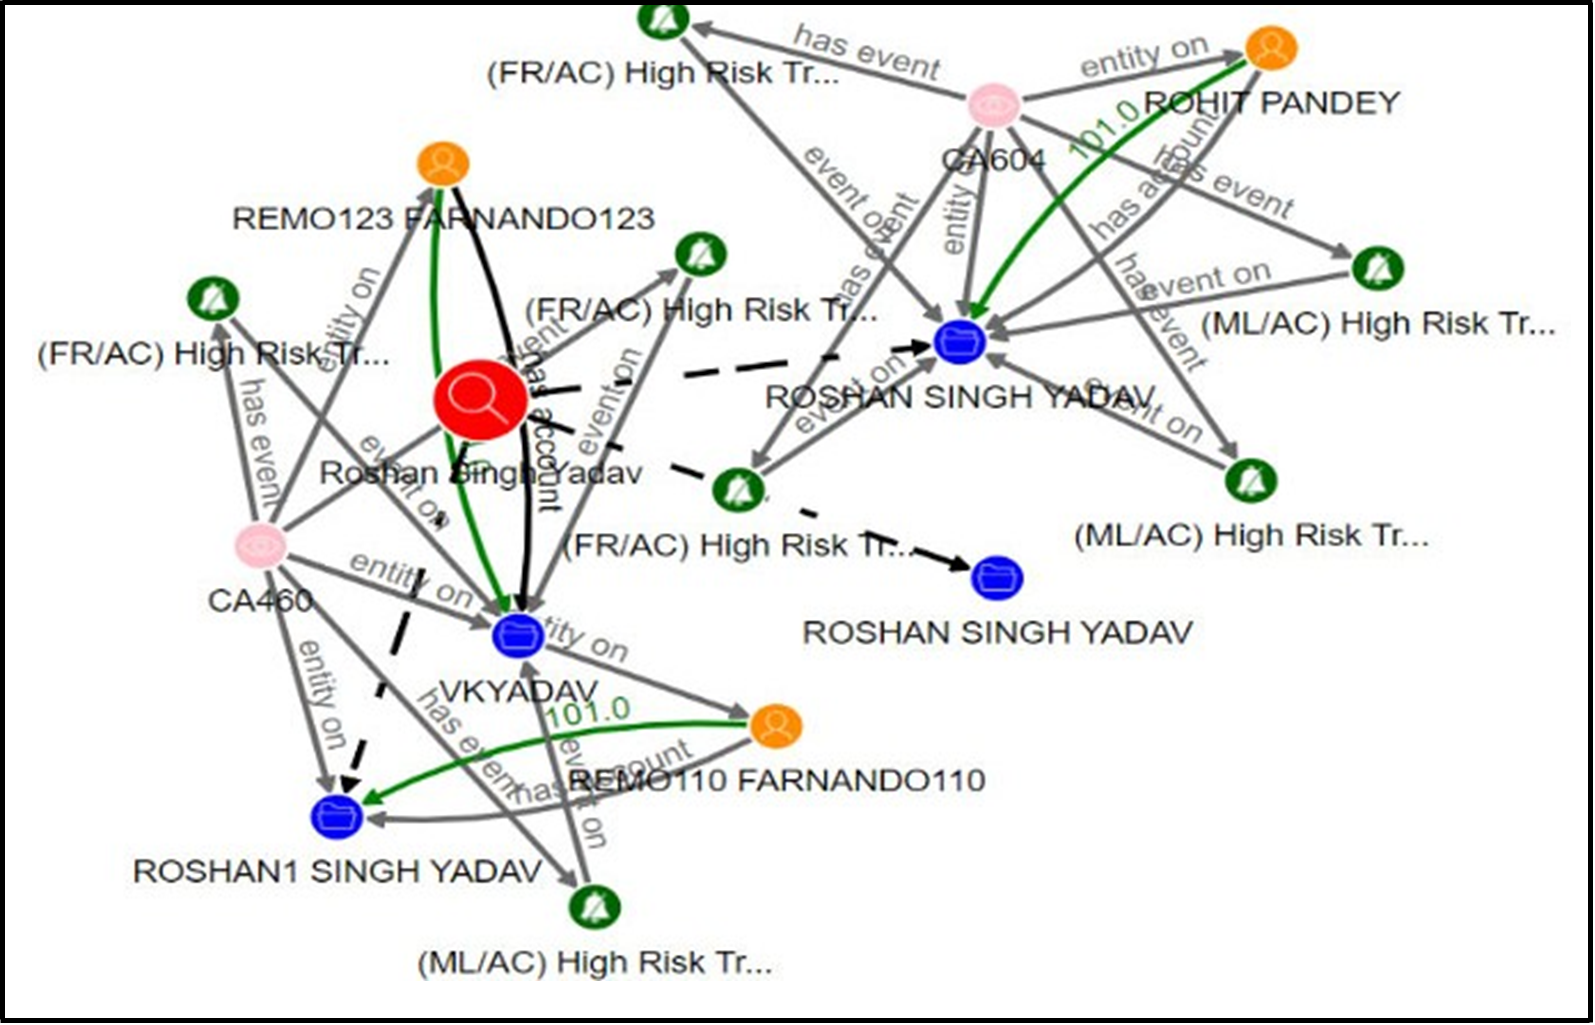
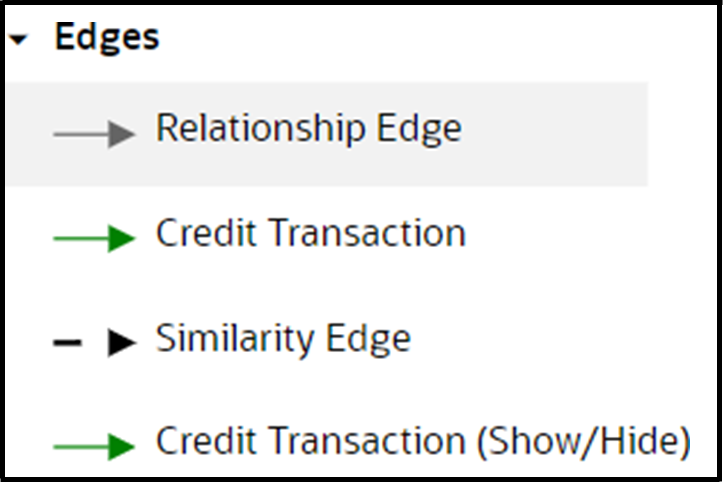
A typical network graph shows nodes and edges. Nodes are entities such as a customer or account. Each node can join to zero, one or many other nodes via a link called an edge which represent relationships between edges, transactions or connecting nodes via similarity edges created by matching. Each type of node is associated with a specific icon on the graph. Graph Details describes the icon displayed on the graph for each type of node.
- The case node and five hops from the case node to include all the events, customers, derived entities, accounts, and transactions that are the focal entities and impact the case.
- Additional nodes and edges that provide case context such as relationship and similarity edges to include external data sources.
- If the user searches for additional entities in the above paragraph, the graph will show the matched entities and connected nodes and edges.
- The user is then able to manipulate the graph by expanding any high-risk entities or parties on unusual transactions to obtain better understanding of the context and risk associated with the case. The analyst can also remove entities and transactions which are not pertinent to the case to provide a snapshot of only the pertinent information.
When a graph shows the relevant information, the case narrative and other paragraphs can be re-run to provide updated summary information. The following figure shows the sample graph.
You can perform many actions on a graph. For more information, see the Graph Details section.
Note:
You must re-execute the paragraph after any modification to view the results in the subsequent paragraphs.
