ECL Reconciliation Analysis for Accounts
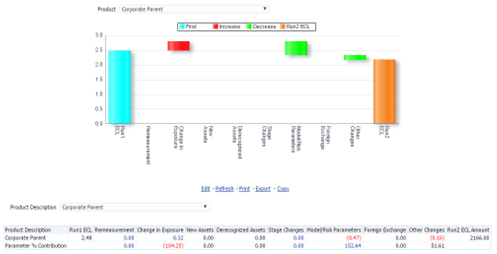
This report is a waterfall chart providing a visual description of the movements between two reporting dates. The tabular report is located following the waterfall chart that details various contents of the chart. Drills are accessible also on the tabular report apart from on the waterfall chart, see the following explanation:
- The first and the last columns represent the run1 and run2 ECLs respectively.
- Across the x-axis, factors are grouped based on similarity and provide a high view of reasons for changes between the runs. A group can further have individual contributing factors, the summation of their combined net effect per group is shown as a column on the waterfall chart.
- A red column indicates the ECL increased between the two runs and green indicates a reduction in ECL.
- If there are no columns visible for a group, say in as Derecognized Assets in the sample image as follows, it means that either constituent factors movements have canceled each other out or as a group, they did not impact in increase or decrease in ECL.
Figure 13-2 The ECL Reconciliation Analysis Report

This report can be drilled down from the column that opens up a separate report:
- Remeasurement
- Change in Exposure
- Stage Changes
- Model or Risk Parameters
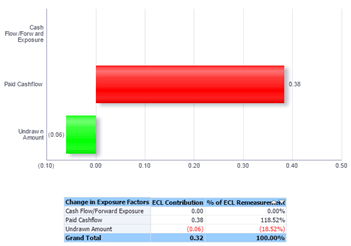
Each drill-down opens a combination of a horizontal bar chart and a tabular report
depicting ECL contribution per factor and its percentage contribution to the factor
group.

Figure 13-3 The ECL Reconciliation Analysis Report
