- User Guide
- Modeling
- Graphs
- Accessing the Graph Summary Page
Accessing the Graph Summary Page
The Graph Summary page gives access to the various graph pipeline functions
such as create, view and delete.
To access the Graph Summary page, follow these steps:
- Click Launch Workspace next to corresponding Workspace to Launch Workspace to display the MMG Dashboard window with application configuration and model creation menu.
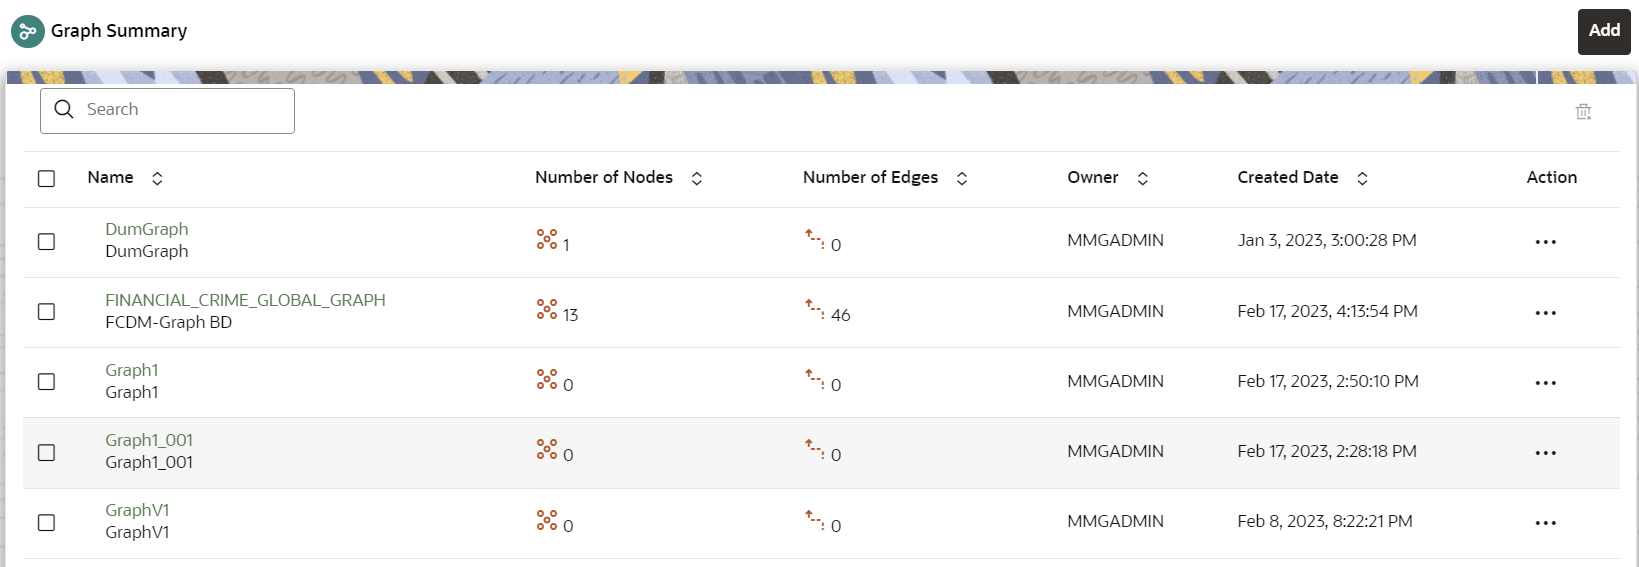
- Click the Graphs icon.This displays the graph pipeline in a tabular format.
Figure 8-95 Graph Summary page
 The following table provides descriptions for the fields and icons on the Graph Summary page.
Table 8-23 Graph Summary Details
Field or Icon Description Search The field to search for a graph pipeline.
Enter specific terms in the field for which you want to search, and press Enter on the keyboard to display the results.
Name The name of the graph pipeline. Number of Nodes The number of nodes present in the graph pipeline. Number of Edges The number of edges present in the graph pipeline. Owner The owner of the graph pipeline. Created Date The date on which the graph pipeline was created. Delete Click to delete multiple graph pipelines. Add Click to create a new graph pipeline. See Adding a Graph Pipeline section. Action Click Action icon to View/Edit/Delete/Download functions on the selected graph pipeline.