- User Guide
- Modeling
- Graphs
- Accessing the Graph Summary Page
- Adding a Graph Pipeline
Adding a Graph Pipeline
To add a graph pipeline:
- Navigate to Graph Summary page.This page displays the graph summary records in a table.
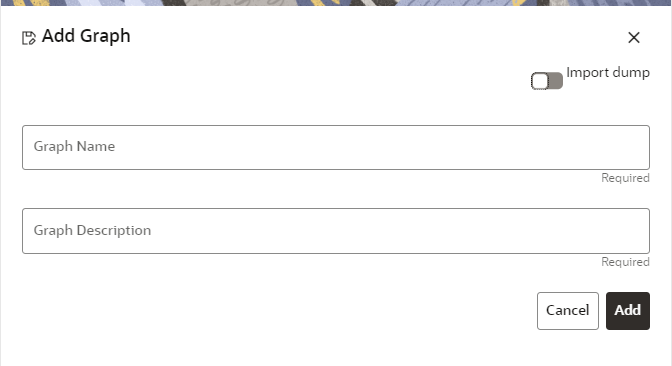
- Click Add.The Add Graphpop-up window is displayed. Figure: Add Graph window.
Figure 8-96 Add Graph window

- In the Graph Name field, enter a name for the graph. The name must be unique to a particular workspace.
- In the Graph Descriptionfield, enter the description for
the graph and click Add. ORYou can import an existing Graph. Use the toggle button to select Import Dump.The following page is displayed.Browse the file and click Import. Once the Import is successful, the Graph Model page is displayed.The Maximum Age of Old session for a graph is 7 days by default. The Maximum age of old session of 7 days specifies that graph would be retained for a period of 7 days. You can modify the description and Max Age of Old session by clicking on the Setting icon. If you want the batch to be created in read-only mode for scheduler screen, enable the option.
- Click Save.The user session of the Graph Pipeline will get refreshed after the set timeline.
- You can perform the following:
- Create a Node
- Create an Edge
- Toggle drawing which will enable or disable the user from dragging components
- Zoom In and Zoom Out