6.4.1.6 Region
This report enables tracking of Balances, reporting lines, business and performance metrics including comparison with selected regions and regional hierarchy at different levels.
You can use the following report filters to further slice and dice the
available report charts:
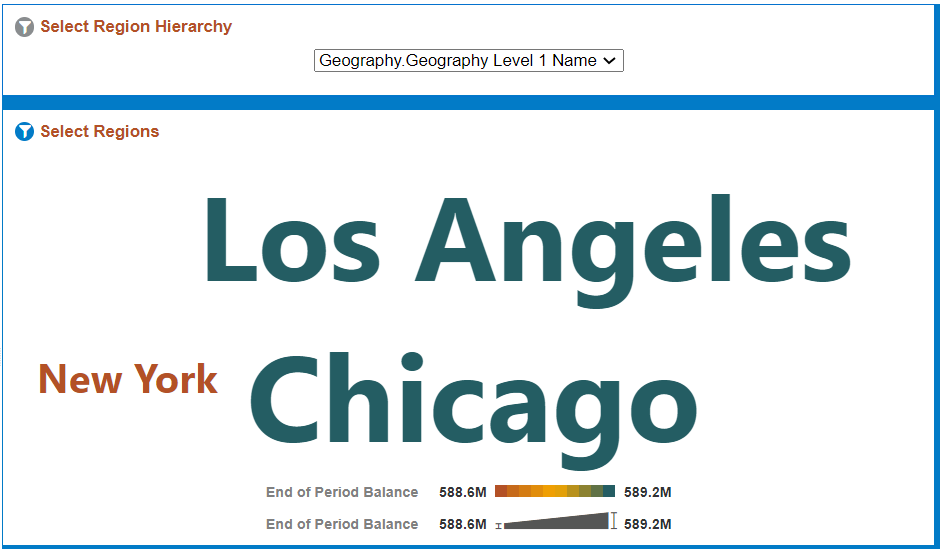
Figure 6-61 Canvas Prompt Filters

In addition, you can use a series of Report Prompts, as previously described, to filter
the data. The report displays the underlying data according to the following Charts:
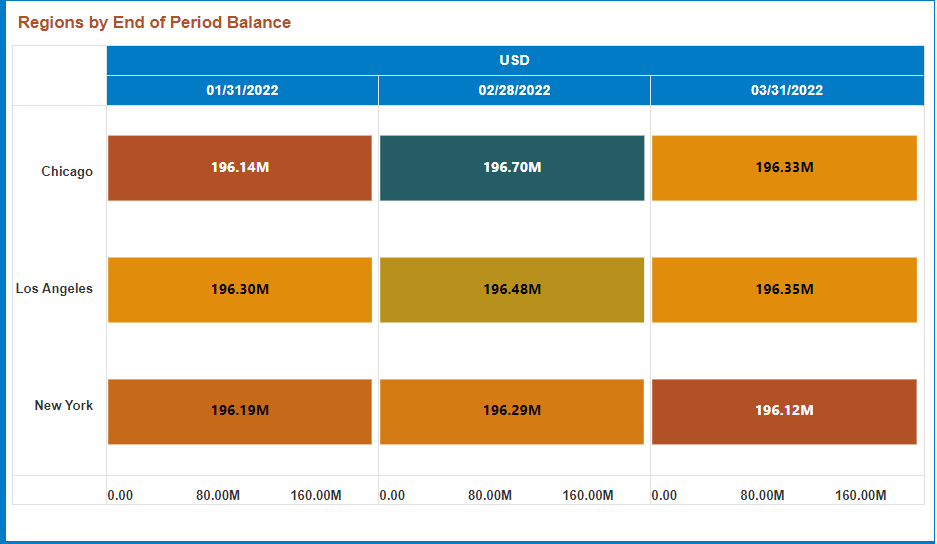
- Regions by End of Period Balance: The chart displays the
End of Period Balances for the region hierarchy or leaf level as selected by the
user.
Figure 6-62 Regions by End of Period Balance
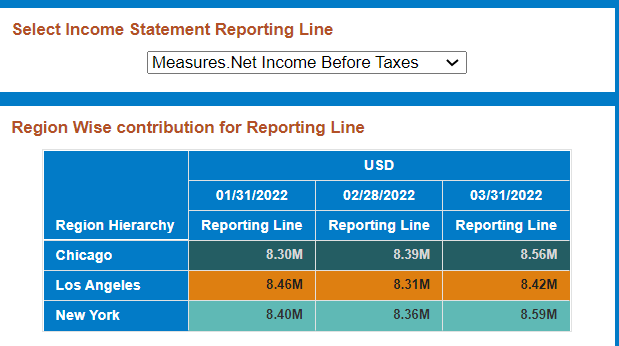
- Region Wise Contribution for Reporting Line: The chart
displays the value of the reporting line for the selected combination of
reporting line, leveraging the Select Income Statement Reporting Line variable
prompt, and region hierarchy, as described earlier in how to leverage Select
Region hierarchy.
Figure 6-63 Region Wise Contribution for Reporting Line
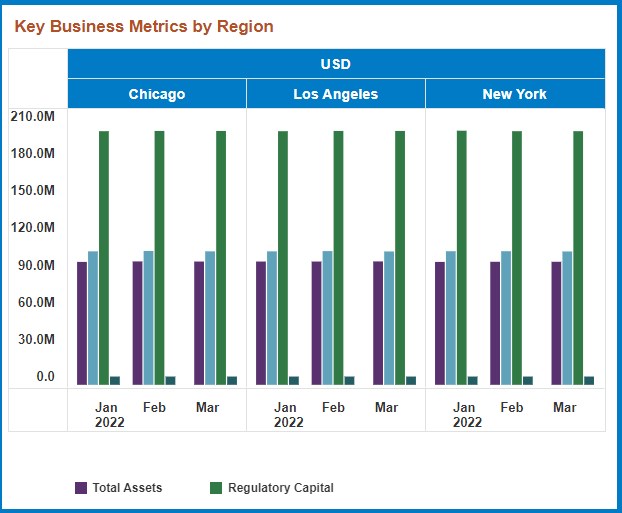
- Key Business Metrics by Region:The chart displays the key
Business Metrics – Total Assets, Total Liabilities, Economic Capital, and
Regulatory Capital for the selected Region hierarchy.
Figure 6-64 Key Business Metrics by Region
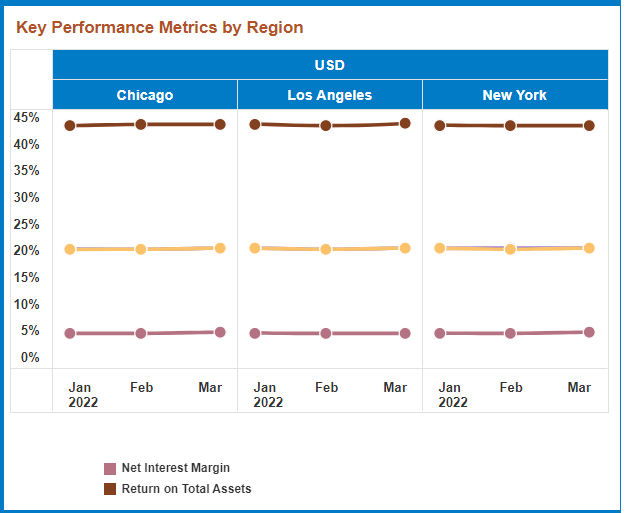
- Key Performance Metrics by Region: The chart displays the
key Business Metrics – Net Interest Margin, Return on Total Assets, Risk
Adjusted Return on Capital, and Return on Equity for the selected Region
hierarchy.
Figure 6-65 Key Performance Metrics by Region
- Other Ratios by Region: The chart displays business
metrics like Net Fee Income, Gross Interest Income, Interest Coverage Ratio and
Debt coverage ratio, all expressed as percentages for the selected region
hierarchy.
Figure 6-66 Other Ratios by Region
