6.3.1.5 Time
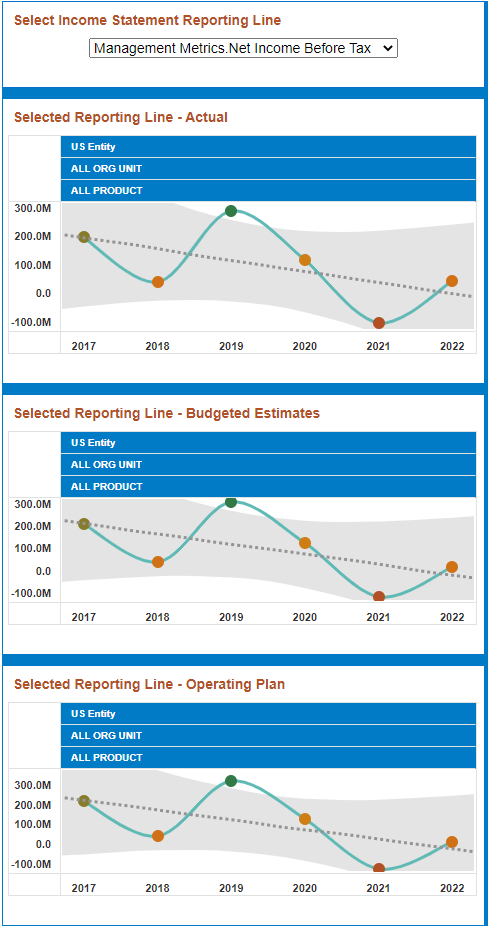
The Time Report allows you to track profitability trends and reporting line trends based on key dimensions, conduct scenario analysis at an aggregated level to gauge profitability variations with Budget and Operating plan. In addition, you can compare actual performance with budgeted/forecasted report.
KPIs are reported across time along with the comparison with plan report users are able to monitor performance, analyze specific metrics, and compare them to budgets or specific benchmarks. They can spot deviations and take corrective action. Opportunities to improve performance can also be identified. The DV tool provides visual representations focusing on the variations observed.
Figure 6-30 Selected Income Statement Reporting Lines

Figure 6-31 Overall Balances

- Key Performance Metrics: The following Key Performance
Metrics can be observed from these set of charts.
- Net Interest Margin: NIM is usually Net Interest Income expressed as a percentage that is, it is the net interest income a bank or financial institution earns in percentage terms on the average interest-earning assets in a specified period.
- Return on Total Assets: Return on Total Assets (ROTA) is a ratio that measures a company's earnings before taxes (NIBT) relative to its total Assets. It is expressed as a percentage.
Figure 6-32 Key Performance Metrics

- Actual: These are actual metric and performance numbers as reported by the bank in their financial statements. These numbers are the outcomes of operations and business strategy that have been executed in the past.
- Budget: A budget’s primary goal is to determine how many resources to allocate to each Business Unit. A fallout of the budgeting exercise are specific expectations around revenue and expected reporting lines as well as financial metrics. Budget numbers thus make business units at different levels responsible for the variances with actual numbers.
- Operating Plan: An operating plan is a financial snapshot of the business in future, as it is best understood today. The result is a forecast of how the business is trending taking into account the latest performance drivers. The banks operating plan is updated regularly. In this way, executives can make changes in real time, adjusting their product strategy, market position, marketing approach, and staffing to minimize variance with budget numbers.