5.5.1.5 Product
This report provides monthly trended results using that you can monitor product line performance, track earnings trend and other key factors at the product levels.
You can use a series of Report Prompts, as previously described, to filter the data. In addition, there are In-Report prompt selections to select the Top/ Bottom N products that you are interested in, and the corresponding data will be displayed.
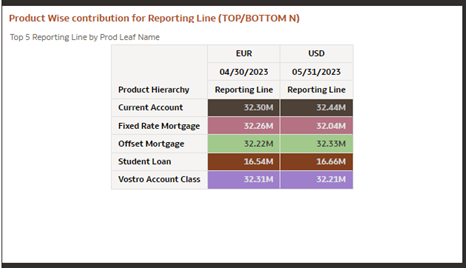
- Product wise contribution for Reporting Line (TOP N);
the same is available for bottom view: In this chart, for the
selected reporting line, the Top N (N selected from the chart prompt) and bottom
N products are displayed in descending order of value of the reporting line.
Figure 5-93 Product wise contribution for Reporting Line (TOP/ BOTTOM N)
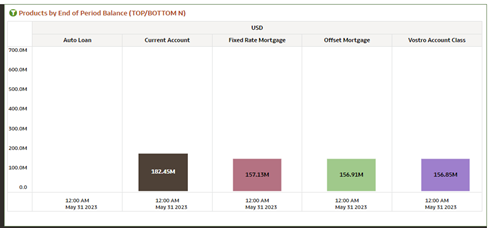
- Product by End of Period Balance (TOP N); the same is
available for bottom view: The chart displays the Top N (N
selected from the chart prompt) and bottom N products sorted in a descending
order by End of Period Balances.
Figure 5-94 Product by End of Period Balance (TOP/ BOTTOM N)
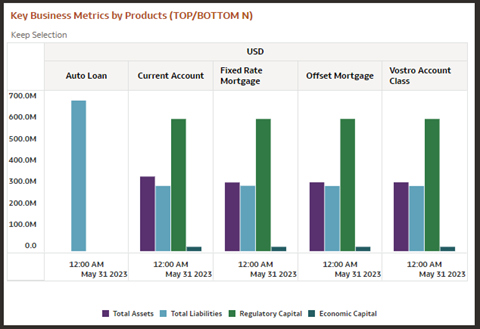
- Key Business Metrics by Products (TOP N); the same is
available for bottom view: The chart displays the Top N (N
selected from the chart prompt) and bottom N organization units sorted in a
descending order by End of Period Balances and provides the breakup between
Asset and Liability Balances along with Regulatory and Economic Capital.
Figure 5-95 Key Business Metrics by Products (TOP/ BOTTOM N)
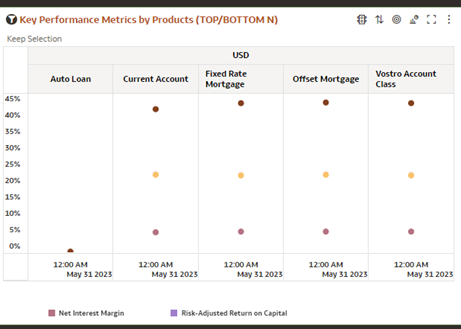
- Key Performance Metrics by Products (TOP N); the same is
available for bottom view: The chart displays the Top N (N
selected from the chart prompt) and bottom N products sorted in a descending
order by End of Period Balances and provides selected KPI’s like NIM, RAROC, ROE
and ROTA of these Products.
Figure 5-96 Key Performance Metrics by Products (TOP/ BOTTOM N)
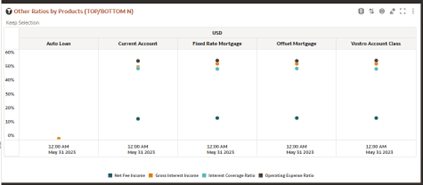
- Other Ratios by Products (TOP N); the same is available
for bottom view: The chart displays the Top N (N selected from
the chart prompt) and bottom N products sorted in a descending order by End of
Period Balances and provides selected business metrics like Net Fee Income,
Gross Interest Income, Interest Coverage Ratio and Debt coverage ratio, all
expressed as percentages.
Figure 5-97 Other Ratios by Products (TOP/ BOTTOM N)
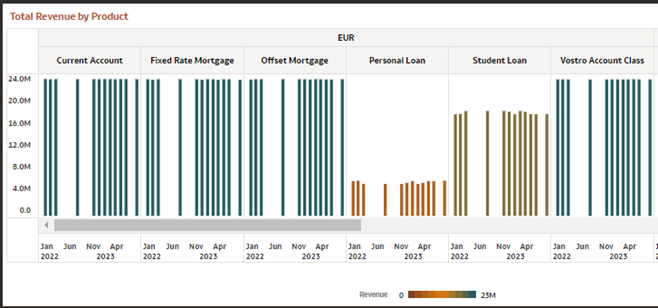
- Total Revenue by product: This chart displays the
revenues generated by the products.
Figure 5-98 Total Revenue by product
- New Accounts by product: This chart displays a time
series view of the new accounts opened with the products displayed in trellis
columns and the income generated from new accounts as lines.
Figure 5-99 New Accounts by product

- Closed Accounts by product: This chart displays a time
series view of the closed accounts opened with the products displayed in trellis
columns and the income generated from the closed accounts as lines.
Figure 5-100 Closed Accounts by product
